10.3. Thermal Properties of U-Pu-Zr and U-Zr Alloy Fuels as a Function of Composition
The fuel thermal properties described in this section are used in all modules of SAS4A and SASSYS-1 codes, and not only in the SSCOMP module. The fuel thermal properties include its specific heat, theoretical density and thermal conductivity. A U-Zr binary alloy is treated as a special case of the U-Pu-Zr ternary alloy. In the SAS4A/SASSYS‑1 codes, one of the following four options are used for providing fuel thermal properties of a channel: (1) temperature-dependent property tables prepared by the user, and supplied to the code as input data, (2) regionwise interpolation of IFR Metallic Fuels Handbook data (as explained in Section 10.3.2, region here implies a triangular part of the U-Pu-Zr ternary system composition triangle), (3) composition- and temperature-dependent fuel property correlations of the report ANL/RAS 85-19 developed before IFR Metallic Fuels Handbook [10-9] in course of the earlier SSCOMP model development [10-4], and (4) Billone’s correlations for Mark-V (i.e., U-20Pu-10Zr) and U-10Zr fuels based on IFR Handbook data. The options available for providing mixed-oxide fuel properties to the codes are described in Section 3.15, and not in the present section.
The specific heat of both metallic and oxide fuels is calculated in subroutine CFUEL, the theoretical density in subroutine RHOF, and the thermal conductivity in subroutines FK and KFUEL. The difference between the two thermal conductivity subroutines FK and KFUEL is that FK is used to calculate the thermal conductivity of a single fuel radial node during steady-state heat transfer calculation, whereas KFUEL is used to calculate the thermal conductivities of all fuel radial modes in a pin axial segment (in a single call, for computational efficiency) during transient heat transfer calculation. The flow diagrams of these subroutines are shown in Figure 10.3.1 to Figure 10.3.5. The above mentioned four options for providing fuel thermal properties along with some other options related to fuel properties, are controlled through the following six input parameters: IRHOK, IMETAL, IFUELM, IFUELC, KFIRR and KDENBU. The input parameter IMETAL>1 implies U-Pu-Zr alloy fuel.
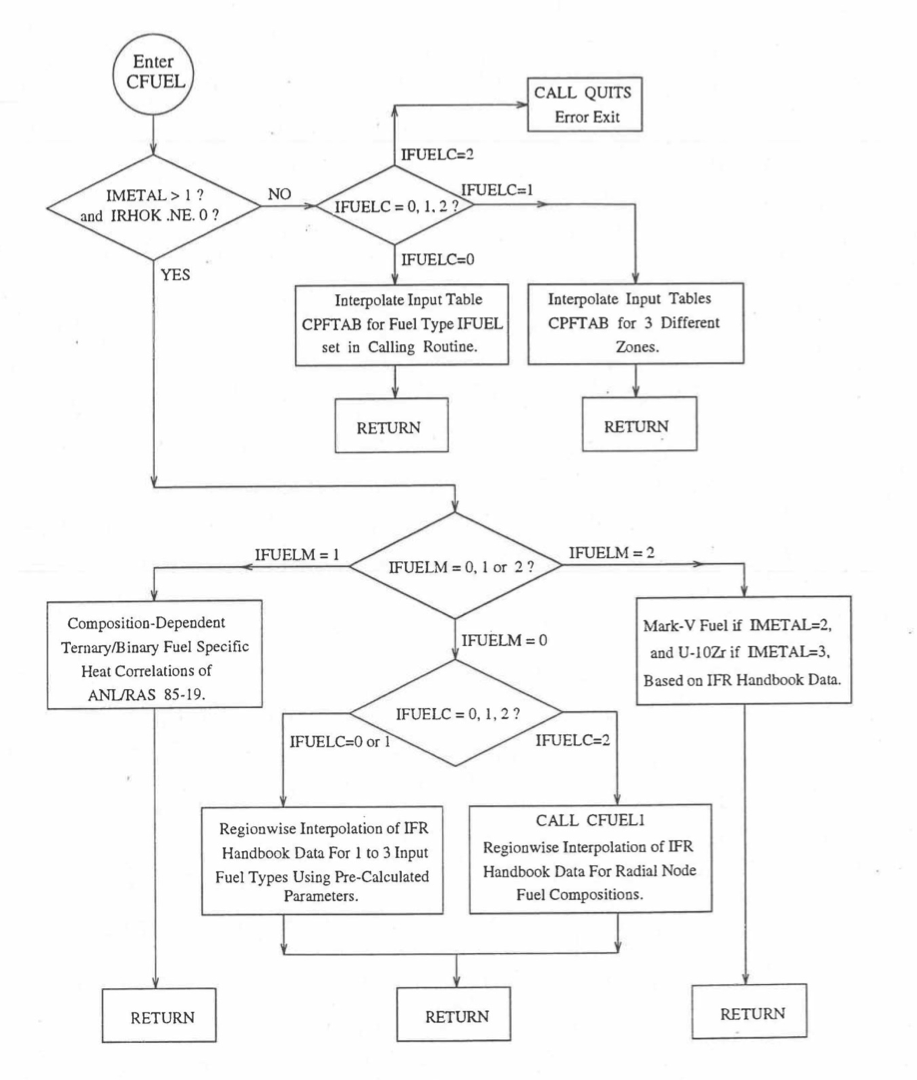
Figure 10.3.1 Flow Diagram of Subroutine CFUEL for Fuel Specific Heat.
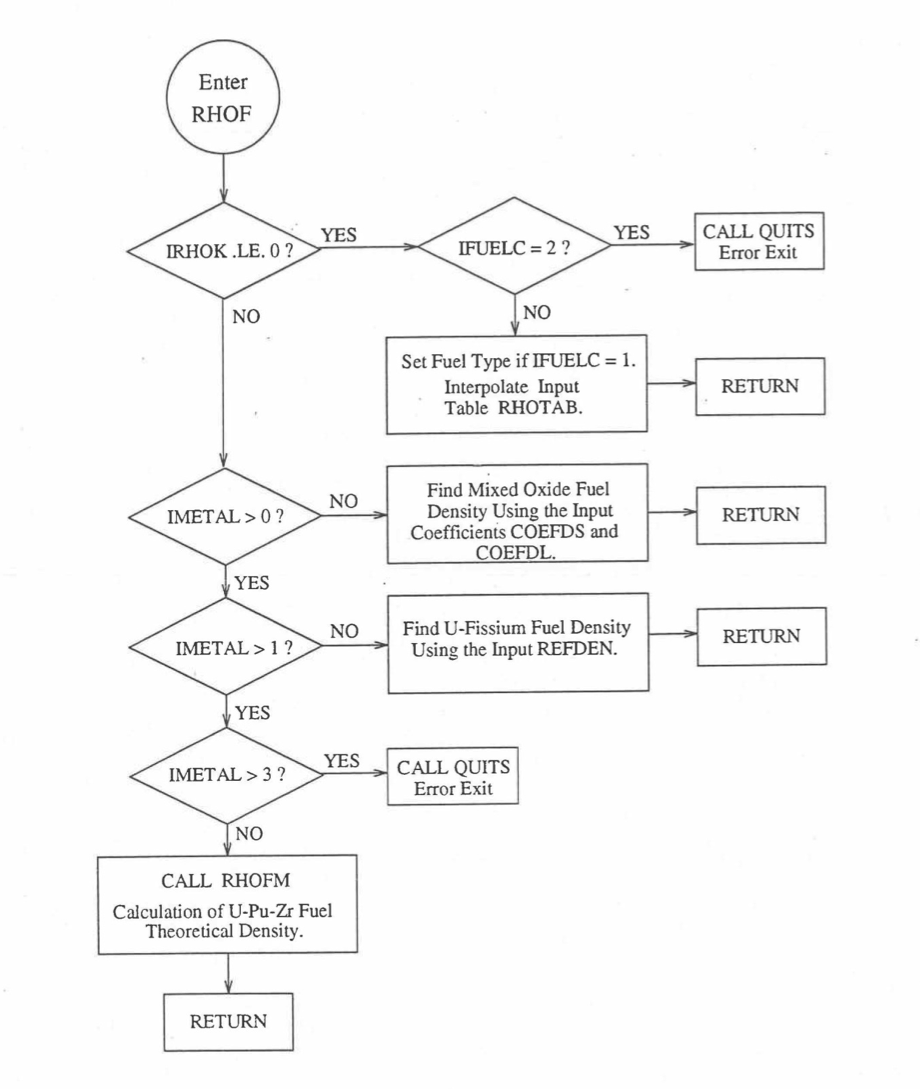
Figure 10.3.2 Flow Diagram of Function Subprogram RHOF for Fuel Theoretical Density.
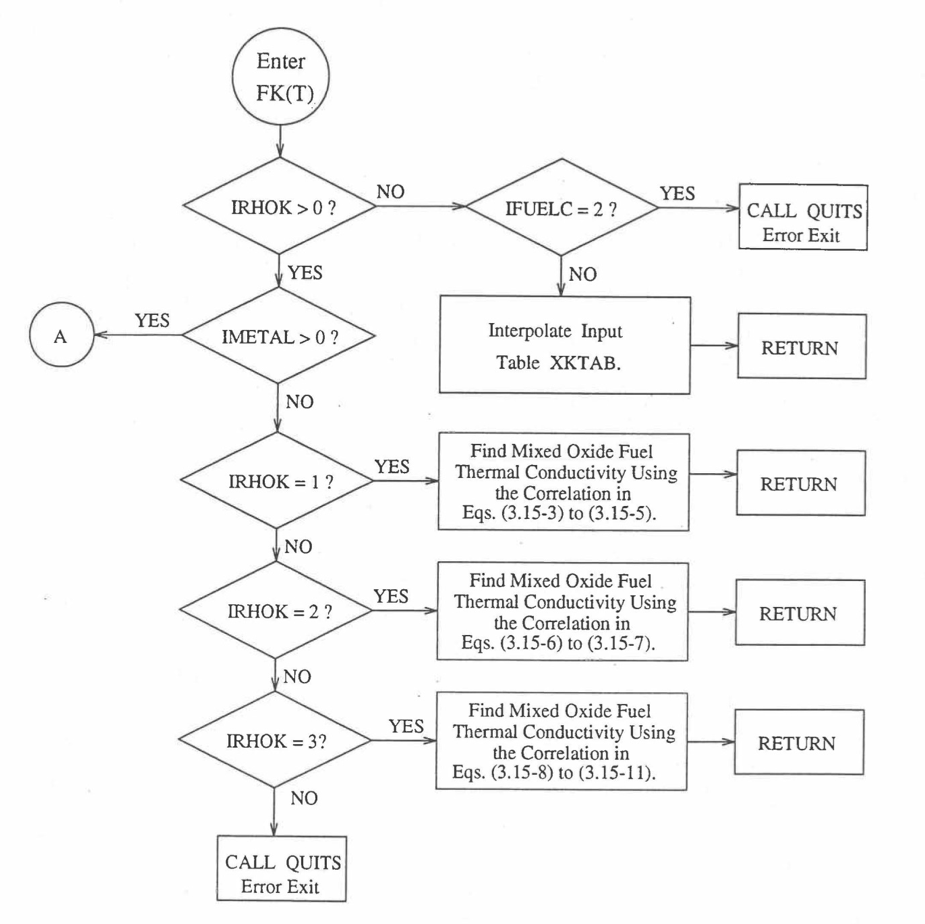
Figure 10.3.3 Flow Diagram of Function subprogram FK for Thermal Conductivity of a Single Fuel Radial Node.

Figure 10.3.4 Flow Diagram of Function subprogram FK for Thermal Conductivity of a Single Fuel Radial Node (Cont’d).

Figure 10.3.5 Flow Diagram of Subroutine KFUEL for Thermal Conductivity of All Fuel Radial Nodes in a Pin Axial Segment.

Figure 10.3.6 Flow Diagram of Subroutine KFUEL for Thermal Conductivity of All Fuel Radial Nodes in a Pin Axial Segment (Cont’d).
10.3.1. Temperature-Dependent Tables
The input parameter IRHOK=0 in a channel implies that temperature-dependent tables of specific heat, theoretical density and thermal conductivity of U-Pu-Zr alloy fuels of a maximum of 8 different alloy compositions (called fuel types in the input description given in Chapter 2) have been prepared by the user and supplied to the code as input data, and one of these tables is to be used in the channel. The core and blanket fuel types to be used in a channel are specified through the input variables IFUELV and IFUELB if the channel has a single radial fuel zone (indicated by the input parameter IFUELC=0). The fuel types are specified through the input array MFTZN if the channel has multiple radial fuel zones (indicated by the input parameter IFUELC=1). The compositions of the U-Pu-Zr metallic alloy fuel types are specified through the input array PUZRTP.
10.3.2. Regionwise Interpolation of IFR Handbook Data
The SAS4A and SASSYS-1 codes are being developed to perform calculations for the Mark-V fuel (U-20Pu-10Zr) and other metallic alloy fuels of different compositions, especially the different fuel compositions across the pin radius resulting form the migration of fuel constituents during steady-state reactor operation. There is thus a need for modeling and correlation development for the thermal properties of U-Pu-Zr alloy fuels as a function of composition. This is so because the IFR Metallic Fuels Handbook [10-8, 10-9] presents thermal properties data for the 3 constituents and certain specific alloys only, and does not always present correlations with their coefficients and transition temperatures as functions of composition. Using the thermal properties data presented in the IFR Metallic Fuels Handbook, a method of regionwise interpolation in the U-Pu-Zr ternary composition triangle has been developed to estimate thermal properties of U-Pu-Zr alloy fuels as a function of composition and temperature. This method of evaluating fuel thermal properties is specified by setting the input parameter IRHOK=1 and the input parameter IFUELM=0 in a channel, and this is the recommended option among the built-in fuel thermal properties options.
Figure 10.3.7 shows the flow diagram of a subroutine PRECAL that is called by the input driver routine INPDRV (see flow diagram of Figure 2.2.2) to pre-calculate, using the method of regionwise interpolation, certain parameters (described below) stored for fast evaluation of U-Pu-Zr alloy fuel thermal properties by fuel type. Fuel thermal properties by fuel type can be used only in case of a single radial fuel zone (IFUELC=0), or multiple (i.e., up to 3) radial fuel zones (IFUELC=1), but not when each fuel radial mesh interval is a unique zone of a different alloy composition (IFUELC=2). In the latter case, fuel thermal properties are evaluated directly using the fuel compositions of the mesh intervals. The pre-calculated parameters by fuel type evaluated by the subroutine PRECAL are not used when IFUELC=2.

Figure 10.3.7 Flow Diagram of Subroutine PRECA1 to Pre-Calculate Parameters Stored for Fast Evaluation of U-Pu-Zr Specific Heat, Theoretical Density and Thermal Conductivity by Fuel Type.

Figure 10.3.8 Flow Diagram of Subroutine PRECA1 to Pre-Calculate Parameters Stored for Fast Evaluation of U-Pu-Zr Specific Heat, Theoretical Density and Thermal Conductivity by Fuel Type (Cont’d).
10.3.2.1. Enthalpy of U-Pu-Zr Fuel
10.3.2.1.1. Introduction
The IFR Metallic Fuels Handbook presents enthalpy and specific heat data for the 3 constituents and certain specific alloys only, and does not present correlations with their coefficients and transition temperatures as functions of composition.
Earlier, before the preparation of the Metallic Fuels Handbook [10-9], a method was developed to estimate the composition-dependent enthalpy of solid U-Pu-Zr alloy fuel by mass-weighted averaging of the enthalpy data of the 3 constituents, i.e., U, Pu and Zr metals [10-4]. Each of the constituent metals undergoes certain crystallographic phase transitions in the solid state that require considerable heat addition (causing an enthalpy jump) at the transition temperatures, but the alloy itself has no sharp transition temperature or enthalpy jump. A drawback of this method [10-4] of estimating U-Pu-Zr enthalpy is that the enthalpy jumps in the constituent metals data are required to be spread over an arbitrarily chosen temperature range containing the transition temperatures. Another drawback is that the enthalpy data for the constituent metals was obtained from a source [10-10] other than the Metallic Fuels Handbook.
The method that is used in the FPIN2 code [10-11] to estimate the composition-dependent specific heat of U-Pu-Zr alloy fuel is also based on mass-weighted averaging of the 3 constituent specific heats. In this method, each constituent specific heat is assumed to be constant over the range of room temperature to the melting point of the constituent metal; and this assumption is tantamount to spreading the enthalpy jumps (due to solid-state phase transitions) over the same temperature range.
Recently, Billone has suggested that the enthalpy of solid U-Pu-Zr alloy fuel as a function of composition could be obtained by mixing the following 3 alloys rather than the 3 constituent metals [10-12]:
U-15 wt % Pu-10 wt % Zr ternary alloy.
U-(10 ± 5) wt % Zr binary alloy, and
Pu metal.
The enthalpy data of U-15Pu-10Zr ternary, U-10Zr binary and Pu metal have been reported in the Metallic Fuels Handbook. The enthalpy of U-Zr binary alloy as a function of Zr content (in the neighborhood of 10 wt %) has also been correlated [10-12] by Billone using data for some binary alloys reported in the Metallic Fuels Handbook, i.e., 87 at. % U-Zr (U-5.4 wt. % Zr), U-10 wt % Zr, 59 at. % U-Zr (U-21.1 wt % Zr), and 39 at. % U-Zr (U-37.6 wt % Zr). The suggestion of mixing the 3 alloys rather than the 3 constituents provides a number of benefits. It removes the drawback of spreading the enthalpy jumps (due to solid-state phase transitions) over an arbitrarily chosen temperature range. The heats of solid-state transitions are naturally spread over the correct temperature range and included in the enthalpy data of the alloys that are mixed. The suggestion also improves the accuracy of the calculated enthalpy of the desired U-Pu-Zr alloy by choosing the 3 basic alloy compositions (that are mixed) in the neighborhood of the desired alloy composition.
Based on (a) this suggestion for obtaining the enthalpy of solid U-Pu-Zr alloy fuel, and (b) the assumption of ideal solution of molten U, Pu and Zr (used in the Metallic Fuels Handbook to obtain U-10Zr and U-15Pu-10Zr enthalpies at and above their liquidus temperatures) for obtaining the enthalpy of liquid U-Pu-Zr fuel, a method of regionwise interpolation and a subroutine HFUEL1 based on it have been developed and incorporated into the SAS4A/SASSYS‑1 codes. This method exactly reproduces enthalpy data in the Handbook for molten U-15Pu-10Zr, U-10Zr, U, Pu and Zr liquids. The enthalpy data in the Handbook for solid U-15Pu-10 Zr, U-5.4Zr, U-10Zr, U-21.1Zr, U-37.6Zr alloys, and solid U and Pu metals are also accurately reproduced by this method.
10.3.2.1.2. Description of the Method
Figure 10.3.9 shows the U-Pu-Zr ternary system composition triangle. To perform design and safety calculations for the Mark-V fuel and other metallic alloy fuels important in the IFR program, including the different fuel compositions across the pin radius caused by migration of fuel constituents during reactor operation, it is sufficient to be able to evaluate enthalpy of alloy compositions (represented by points) located in a small region, equal in area to about one-third of the whole composition triangle, in the U corner of the triangle. The present method models and evaluates the enthalpy of all alloy compositions located in the triangular region UEPu of Figure 10.3.9.
The enthalpy of a molten alloy (at and above its liquidus temperature) as a function of composition is evaluated in the present method by assuming the molten alloy to be an ideal solution of the 3 liquid components U, Pu and Zr. The enthalpy evaluation approach for the molten alloy is changed from that for the solid alloy because (1) the IFR Metallic Fuels Handbook uses this 3-component ideal solution assumption for evaluating enthalpy of molten U-10Zr, and U-15Pu-10Zr, and recommends this assumption for other alloy compositions, and (2) the solid-state phase structure is lost after melting, i.e., the liquid obtained after melting is the same irrespective of the solid phase which melted; the alternate approach of arriving at the enthalpy at liquidus by adding the heat of fusion and the sensible heat (required for raising temperature form solidus to liquidus) to the enthalpy at solidus contains uncertainties which can be avoided by using the 3-liquid ideal solution assumption. Between the solidus and liquidus temperatures, the enthalpy of the alloy is linearly interpolated as recommended in the Metallic Fuels Handbook. The solidus and liquidus temperatures required in the present method may be either obtained from experimental measurements for the desired alloy, if available, or calculated using a subroutine developed by Pelton [10-13] and incorporated into the SAS4A/SASSYS‑1 codes.

Figure 10.3.9 Diagram Showing Enthalpy Interpolation Regions for Solid U-Pu-Zr Ternary Alloy.
Base on the enthalpy data available in the IFR Handbook, the present method divides the triangular region UEPu, i.e., the region representing all those alloy compositions whose enthalpy in the solid state can be evaluated by the present method, into four regions as shown in Figure 10.3.9. There are data in the Handbook for solid U, Pu, U-15Pu-10Zr (represented by point A in Figure 10.3.9), and six U-Zr binary alloys with Zr content ranging form 5.4 wt % (point D) to 75.7 wt %. Because the IFR program deals with fuels having a limited amount of Zr, the highest Zr content U-Zr binary alloy data used in the method is that of U-37.6 wt % Zr (point E). In region 1 given by triangle ADE of Figure 10.3.9, the enthalpy of a solid U-Pu-Zr alloy of a desired composition represented by point F is obtained by mixing or linearly interpolating between the database alloys A (i.e., U-15Pu-10Zr) and B (i.e., the U-Zr binary defined by the point of intersection of line AF). The Zr content of binary alloy B is given in Section D, and the enthalpy of this binary alloy is found form a correlation by Billone [10-12] of all the enthalpy data in the Handbook for U-Zr alloys between points D and E. The coefficients of this correlation are composition-dependent. By comparison with data in the Handbook, this U-Zr enthalpy correlation has been found to be accurate.
The enthalpy of a solid U-Pu-Zr alloy of a desired composition represented by a point inside region 2 (given by triangle ADPu of Figure 10.3.9 is obtained by mixing the 3 database alloys A, D (i.e., U-5.4Zr) and Pu metal. The enthalpy of a solid U-Pu-Zr alloy of a desired composition represented by a point inside region 3 (given by triangle AEPu) is obtained by mixing the 3 database alloys A, E (i.e., U-37.6Zr) and Pu as shown in Table 10.3.1. Regions 1, 2 and 3 are all in the vicinity of the important ternary fuel U-15Pu-10Zr, and in the present method the enthalpy data for this fuel has a proportional influence on the interpolated enthalpy for any desired alloy composition in these three regions. The enthalpy of a solid U-Pu-Zr alloy of a desired composition represented by a point inside region 4 (given by triangle UDPu) is obtained by mixing the database alloy D, and U and Pu metals. The enthalpy of U metal used in the present method is obtained from data and correlation given in the Handbook because an extrapolation of the U-Zr binary alloy enthalpy correlation does not produce an accurate U metal enthalpy. The enthalpies of the database alloys used in the interpolation are given in Section C. The proportions or weight fractions of the 3 database alloys in mixing are given in Section D.
Between the first and the last solid-state phase transition temperatures, 873 K and 923 K, the specific heat of database alloy A (i.e., U-15Pu-10Zr) is much higher than the specific heat above and below this temperature range. These transition temperatures, denoted by \(T_{\alpha}\) and \(T_{\gamma}\), are required for the other database alloys and the desired U-Pu-Zr alloy in order to accurately account for the specific heat variation over this temperature range. In the present method, these transition temperatures for the U-Zr binary alloys used as database, and for all U-Pu-Zr ternary alloy compositions in regions 1, 2 and 3 are assumed to be equal to those of database alloy A because of lack of composition-dependent correlations for the transition temperatures. Such an assumption was suggested by Billone [10-12] for U-Pu-Zr alloys in the vicinity of U-15Pu-10Zr, and for U-Zr binary alloys used in mixing calculations. The choice of \(T_{\alpha}\) and \(T_{\gamma}\) for Pu metal is immaterial because its enthalpy data, after the simplification suggested by Billone [10-12] and described in Section C, does not have any temperature range of abruptly high specific heat. In region 4 of Figure 10.3.9, the average specific heat of U metal between its first and last transition temperatures is abruptly high, and therefore, \(T_{\alpha}\) is interpolated between the value of \(T_{\alpha}\) (942 K) for U metal [10-8] and the assumed value for other databases (873 K); and \(T_{\gamma}\) is interpolated between the value of \(T_{\gamma}\) (1049 K) for U metal [10-8] and the assumed value for other databases (923 K). These transition temperatures are summarized in Table 10.3.1.
Section C describes the enthalpy correlations for the basic alloys and their comparison with the data in the Handbook. Section D describes the equations used for interpolating between the database alloys. Section E summarizes the variation of fuel enthalpy with composition computed using the subroutine HFUEL1 based on this method.
Database Alloys |
|||||
Regiona |
1 |
2 |
3 |
Desired Alloy \(T_{\alpha}, K^{b}\) |
Desired Alloy \(T_{\gamma}, K^{b}\) |
Region 1 |
U-15Pu-10Zr |
U-xZrc |
not required |
873 |
923 |
Region 2 |
U-15Pu-10Zr |
U-5.4455Zr |
Pu metal |
873 |
923 |
Region 3 |
U-15Pu-10Zr |
U-37.6105Zr |
Pu metal |
873 |
923 |
Region 4 |
U metal |
U-5.4455Zr |
Pu metal |
873 to 942d |
923 to 1049e |
a These regions are shown on the U-Pu-Zr ternary composition triangle in Figure 10.3.9.
b \(T_{\alpha}\) and \(T_{\gamma}\) denote the first and the last solid-state phase transition temperatures of the alloy. \(T_{\alpha}\) and \(T_{\gamma}\) of alloy compositions in the vicinity of U-15Pu-10Zr are assumed to be equal to those of U-15Pu-10Zr, i.e., 873 K and 923 K, as suggested by Billone [10-12].
c The weight fraction x of Zr is selected such that the point representing U-xZr binary lies on the line joining the points representing the desired alloy composition and U-15Pu-10Zr database alloy on the ternary composition triangle shown in Figure 10.3.9.
d Interpolated between 942 K (the value for U metal) and 873 K (the assumed value for other databases, see footnote b).
e Interpolated between 1049 K (the value for U metal) and 923 K (the assumed value for other databases, see footnote b).
10.3.2.1.3. Enthalpy Correlations of Database Alloys
Figure 10.3.10 to Figure 10.3.16 show the temperature dependence of the enthalpy of all the basic alloys used in the present method. The difference in behavior of a database alloy when mixed to produce a desired alloy composition, e.g., U-20Pu-20Zr, as compared to its behavior in isolation is also clarified by these figures. For this purpose, the comparison of enthalpy of the basic alloy in isolation, evaluated from the correlations used in the present method, with the data in the Metallic Fuels Handbook [10-8] is also shown. These plots cover the entire temperature range from 298 K (zero enthalpy reference temperature) to 2000 K, a temperature well beyond the liquidus. In the following sections, the enthalpy correlations of the database alloys for use in solid and liquid phases are separately described.
Database Used in Liquid Phase
The enthalpy of a molten U-Pu-Zr alloy fuel (at and above its liquidus temperature) is evaluated by assuming the molten alloy to be an ideal solution of the 3 liquid components U, Pu and Zr. Thus the enthalpies of the 3 liquid components as functions of temperature from the database. Based on the data for enthalpy at U liquidus and specific heat of liquid U given in the Handbook [10-8], the enthalpy of liquid U can be written as
(10.3‑1)
where
\(H_{\text{lu}}\) = enthalpy of liquid U, J/mol
\(T\) = temperature of liquid U, K
58347 = liquid U enthalpy (J/mol) at its melting point 1408 K,
48.66 = liquid U specific heat, J/mol-K.
Eq. (10.3-1) simplifies to
(10.3‑2)
Similarly, based on the data for enthalpy at liquidus and specific heat of the liquid phase given in the Handbook for Pu and Zr, the following equations for liquid phase enthalpy are obtained:
(10.3‑3)
(10.3‑4)

Figure 10.3.10 Enthalpy of U-15Pu-10Zr Obtained from Eqs. (10.3-2) to (10.3-5) That is Used as Database 1 in Regions 1, 2 and 3; and its Comparison with Metallic Fuels Handbook Data.

Figure 10.3.11 Enthalpy of U Metal Obtained From Eqs. (10.3-2) and (10.3-6) That is used as Database 1 in Region 4; and its Comparison With Metallic Fuels handbook Data.

Figure 10.3.12 Enthalpy of U-5.4Zr Obtained From Eqs. (10.3-2), (10.3-4) and (10.3-7) That is Used as Database 2 in Regions 1, 2 and 4; and its Comparison With Metallic Fuels Handbook Data.

Figure 10.3.13 Enthalpy of U-10Zr Obtained from Eqs. (10.3-2), (10.3-4) and (10.3-7) That is Used as Database 2 in Regions 1, 2 and 4; and its Comparison With Metallic Fuels Handbook Data.

Figure 10.3.14 Enthalpy of U-21.1Zr Obtained From Eqs. (10.3-2), (10.3-4) and (10.3-7) That is Used as Database 2 in Region 1; and its Comparison With Metallic Fuels Handbook Data.

Figure 10.3.15 Enthalpy of U-37.6Zr Obtained From Eqs. (10.3-2), (10.3-4) and (10.3-7) That is Used as Database 2 in Regions 1 and 3; and its Comparison With Metallic Fuels Handbook Data.

Figure 10.3.16 Enthalpy of Pu Metal Obtained From Eqs. (10.3-3) and (10.3-8) That is Used as Database 3 in Regions 2, 3 and 4; and its Comparison With Metallic Fuels Handbook Data.
where
\(H_{\text{lp}}\), \(H_{\text{lz}}\) = enthalpies of liquid Pu and liquid Zr, J/mol
\(T\) = temperature of the liquid phase, K.
When mixed to form a U-Pu-Zr molten mixture, Eqs. (10.3-2) to (10.3-4) are used for all temperatures at and above the liquidus temperature of the U-Pu-Zr alloy, even if the liquidus temperature is below the melting point of U, Pu or Zr.
Database 1 Used in Solid Phase
As described in Section B, the ternary fuel U-15Pu-10Zr is used as database 1 in regions 1, 2 and 3 of Figure 10.3.9; and the U metal is used as database 1 in region 4. The enthalpy data and correlation for U-15Pu-10Zr presented in the Metallic Fuels Handbook [10-8] and in the memorandum by Billone [10-12] can be written as
(10.3‑5)
where
\(H_{\text{a}}\) = enthalpy of U-15Pu-10Zr alloy, J/mol
\(T\) = temperature of the alloy, K
Here 1379 K and 1588 K are the solidus and liquidus temperatures of this alloy. In the present method, Eqs. (10.3-5d) and (10.3-5e) are never required. Equation (10.3-5b) covers the temperature range containing solid-state phase transitions. When mixed to form a desired U-Pu-Zr alloy composition, Eq. (10.3-5c) for the enthalpy in the temperature range above the solid-state phase transitions is extended up to the solidus temperature of the desired alloy. This difference in behavior of U-15Pu-10Zr when mixed to produce a desired alloy composition, e.g., U-20Pu-20Zr, as compared to its behavior in isolation is shown in Figure 10.3.10.
The enthalpy data and correlation for U metal (used as database 1 in region 4) presented in the Metallic Fuels Handbook [10-8] can be written as
(10.3‑6)
where
\(H_{\text{u}} \left( T \right)\) = enthalpy (J/mol) of U metal at temperature T(K).
Here 942 K and 1049 K are the first and the last solid-state phase transition temperatures of U metal, and 1408 K is the melting point. The average specific heat [10-8] over the solid-state phase transition range is 113.467 J/mol-K as used in Eq. (10.3-6b). In the present method, Eq. (10.3-6d) is never required. When mixed to form a desired U-Pu-Zr alloy composition, Eq. (10.3-6c) for the enthalpy in the temperature range above the solid-state phase transitions is extended up to the solidus temperature of the desired alloy. This difference in behavior of U metal when mixed to produce a desired alloy composition, e.g., U-20Pu-2Zr, as compared to its behavior in isolation is shown in Figure 10.3.11.
Database 2 Used in Solid Phase
As described in Section B, U-Zr binary alloys of 5.4 to 37.6 wt % Zr content are used as database 2 in different regions as given in Table 10.3.1. The enthalpy data and correlations for 87 at.% U-Zr (U-5.4wt %Zr), U-10 wt %Zr, 59 at.% U-Zr (U-21.1wt %Zr), and 39 at.% U-Zr (U-37.6wt %Zr) presented in the Metallic Fuels Handbook have been correlated by Billone [10-12] into the following single equation with composition-dependent coefficients. Here the relationships between atom fractions and weight fractions were derived using an average atomic weight of 236.678 for U (based on a U-235 enrichment of 0.478 weight fraction as done by Billone for Mark-V fuel), an atomic weight of 91.22 from Zr, and an atomic weight of 239.13 for Pu.
(10.3‑7)
where
\(H_{\text{uz}} \left( T \right)\) = enthalpy (J/mol) of the U-Zr binary alloy at temperature T (K),
\(A_{\text{u}}, A_{\text{z}}\) = atom fractions of U and Zr in the alloy,
\(T_{\gamma}\) = the highest solid-state phase (\(\gamma\)-phase) transition temperature,
\(T_{\text{s}}\), \(T_{\text{l}}\) = solidus and liquidus temperatures of the U-Zr binary alloy.
For the U-Zr binary alloy, the temperatures \(T_{\gamma}\), \(T_{\text{s}}\) and \(T_{\text{l}}\) should be taken form the U-Zr phase diagram. For U-10 wt% Zr, the temperatures \(T_{\gamma}\), \(T_{\text{s}}\) and \(T_{\text{l}}\) are 1000 K, 1506 K and 1669 K. In the present method, Eqs. (10.3-7c) and (10.3-7d) are never required. When mixed to form a desired U-Pu-Zr alloy composition, the temperatures \(T_{\gamma}\), \(T_{\text{s}}\) and \(T_{\text{l}}\) for the U-Pu-Zr ternary alloy are to be used in Eq. (10.3-7) as suggested by Billone [10-12]. In the present method, this amounts to (1) lowering \(T_{\gamma}\) from the U-Zr value of about 1000 K to the U-Pu-Zr alloy value of 923 K (see Table 10.3.1), and (2) extending Eq. (10.3-7b) for U-Zr enthalpy in the γ-phase temperature range to the solidus temperature of the desired U-Pu-Zr alloy composition. This difference in behavior of four U-Zr alloys (database 2 alloys) when mixed to produce a desired alloy composition, e.g., U-20Pu-20Zr, as compared to their behavior in isolation is shown in Figure 10.3.12 to Figure 10.3.15. These plots also show the agreement between the enthalpy of U-Zr alloys in isolation, evaluated from this correlation, with the data in the Metallic Fuels Handbook [10-8].
Database 3 Used in Solid Phase
As described in Section B, the Pu metal is used as database 3 in regions 2, 3, and 4. Region 1 does not require this database. The enthalpy data for Pu metal presented in the Metallic Fuels Handbook [10-8] has a number of solid-state phase transitions causing relatively small enthalpy jumps at the transition temperatures. As suggested by Billone [10-12], the following equation is a simplified representation of Pu metal enthalpy data [10-8], in the spirit of mixing to produce a desired U-Pu-Zr alloy composition (the value of the average Pu specific heat from the reference temperature of 298 K to Pu melting point of 913 K has been corrected):
(10.3‑8)
where
\(H_{\text{p}} \left( T \right)\) = enthalpy (J/mol) of Pu metal at temperature T,
913 K = the melting point of Pu metal
\(T_{\text{s}}\), \(T_{\text{l}}\) = solidus and liquidus temperatures of the desired U-Pu-Zr alloy composition, and not of pure Pu metal.
Here 46.286 J/mol-K is the average Pu specific heat between 298 K and 913 K, and 34.434 J/mol-K is the specific heat of the last solid-stat phase (\(\varepsilon\)-phase) of Pu metal that is extended up to the liquidus temperature of the desired U-Pu-Zr alloy composition to account for the sensible heat absorbed by Pu. Equation (10.3-8c) indicates that the Pu heat of fusion required for solid-to-liquid phase transition is added linearly between the solidus and liquidus temperatures of the desired U-Pu-Zr alloy composition. In the present method, Eqs. (10.3-8c) and (10.3-8d) are never required. The difference in behavior of Pu metal when mixed to produce a desired alloy composition, e.g., U-20Pu-20Zr, as compared to its behavior in isolation is shown in Figure 10.3.16. This plot also shows the comparison between the enthalpy of Pu metal in isolation with the date in Metallic Fuels Handbook [10-8]. In Figure 10.3.16, the Pu enthalpy above the solidus temperature of the desired U-Pu-Zr alloy composition was obtained by linearly joining the enthalpy at solidus evaluated from Eq. (10.3-8b) with the enthalpy at liquidus evaluated from Eq. (10.3-3b) as mentioned in Section B.
It should be noted that the contribution of Pu enthalpy to U-Pu-Zr fuel compositions in the vicinity of U-15Pu-10Zr (point A of Figure 10.3.9) is small because the corner Pu of the ternary composition triangle is far removed from point A and the point representing the desired fuel composition. The major contribution comes from U-15Pu-10Zr enthalpy.
10.3.2.1.4. Method of Interpolation Between Database
As described in Section B, the enthalpy of a desired U-Pu-Zr fuel composition at and above its liquidus temperature is evaluated by assuming it to be an ideal solution of the 3 liquid components U, Pu and Zr whose enthalpies are given by Eqs. (10.3-2) to (10.3-4). This method is tantamount to mass-weighted averaging of the component enthalpies.
(10.3‑9)
where
\(h_{\text{l}} \left( T \right)\) = enthalpy (J/kg) of a U-Pu-Zr fuel composition at a temperature T, at and above its liquidus,
\(W_{\text{u}}\), \(W_{\text{p}}\), \(W_{\text{z}}\) = weight fractions of U, Pu and Zr in the U-Pu-Zr fuel composition
\(H_{\text{lu}}, H_{\text{lp}}, H_{\text{lz}}\) = enthalpies (J/mol) of U, Pu and Zr metals in the liquid phase
\(a_{\text{u}}\), \(a_{\text{p}}\), \(a_{\text{z}}\) = atomic weight of U, Pu and Zr,
1000 = conversion factor from J/gm to J/kg.
The method of interpolation to evaluate the enthalpy of a U-Pu-Zr fuel composition at and below its solidus temperature consists of first determining the region of the ternary composition triangle (shown in Figure 10.3.9) in which the desired fuel composition lies, and then finding the weight fractions in which the 3 database alloys of the region are required to be mixed to obtain the desired fuel composition. The mass balance of he 3 constituents requires that the following 3 equations be satisfied by the weight fractions of the 3 database alloys.
(10.3‑10)
(10.3‑11)
(10.3‑12)
where
\(W_{\text{u}1}\), \(W_{\text{p}1}\), \(W_{\text{z}1}\) = weight fractions of U, Pu and Zr in database alloy 1 of the region in which the desired fuel composition lies,
\(W_{\text{u}2}\), \(W_{\text{p}2}\), \(W_{\text{z}2}\) = weight fractions of U, Pu and Zr is database alloy 2 of the region,
\(W_{\text{u}3}\), \(W_{\text{p}3}\), \(W_{\text{z}3}\) = weight fractions of U, Pu and Zr in database alloy 3 of the region,
\(W_{\text{u}}\), \(W_{\text{p}}\), \(W_{\text{z}}\) = weight fractions of U, Pu and Zr in the desired fuel composition,
\(X_{1}, X_{2}, X_{3}\) = weight fractions of database alloys 1, 2, and 3 in which they must be mixed.
It should be noted that the sum of U, Pu and Zr weight fractions in each database alloy is 1.
(10.3‑13)
Adding Eqs. (10.3-10) to (10.3-12), and substituting Eq. (10.3-13), one obtains
(10.3‑14)
Equations (10.3-11), (10.3-12) and (10.3-14) provide a set of 3 linear equations in the variables \(X_{1}, X_{2}\) and \(X_{3}\). The solution of this set is given by
(10.3‑15)
where
(10.3‑16)
(10.3‑17)
(10.3‑18)
(10.3‑19)
The sum of \(X_{1}, X_{2}\) and \(X_{3}\) is always 1. In case of interpolation, the values of \(X_{1}\), \(X_{2}\) and \(X_{3}\) are always positive. If any extrapolation were involved, the value of at least one weight fraction becomes negative which is entirely avoided in the present method. For region 4 of Figure 10.3.9, the mixing fractions of the database alloys given by Eqs. (10.3-15) to (10.3-19) simplify to the following:
(10.3‑20)
(10.3‑21)
(10.3‑22)
The Zr weight fraction of database alloy 2 to be used in region 1 of Figure 10.3.9 is found by writing the general equation of the line joining points A and F, i.e., the points representing the U-15Pu-10Zr database and the desired fuel composition.
(10.3‑23)
where
\({W'}_{\text{p}}, {W'}_{\text{z}}\) = weight fractions of Pu and Zr corresponding to any point on the line AF.
The Zr weight fraction of database alloy 2 is then found by setting \({W'}_{\text{p}} = 0\) in Eq. (10.3-23) because database 2 is a U-Zr binary alloy.
(10.3‑24)
where
x = Zr weight fraction of database alloy 2 to be used in region 1.
The enthalpy of the desired U-Pu-Zr fuel composition at and below its solidus temperature is then evaluated by mass-weighted averaging of the enthalpies of the 3 database alloys of the region in which the desired fuel composition lies.
(10.3‑25)
where
\(h \left( T \right)\) = enthalpy (J/kg) of the U-Pu-Zr fuel composition at a temperature T, at and below its solidus,
\(H_{1}, H_{2}, H_{3}\) = enthalpies (J/mol) of the 3 database alloys at temperature T,
\(a_{1}, a_{2}, a_{3}\) = average atomic weights of the 3 database alloys,
1000 = conversion factor from J/gm to J/kg.
10.3.2.1.5. Subroutine HFUEL1 and Specific Heat by Fuel Type
Figure 10.3.17 shows flow diagram of the subroutine HFUEL1 for calculating the enthalpy, based on this method of regionwise interpolation, of a U-Pu-Zr alloy fuel as a function of composition and temperature. The specific heat of each input fuel type of U-Pu-Zr alloy is evaluated using the 9 parameters defined in Figure 10.3.18 that are calculated using the subroutine HFUEL1 as described in this section. Figure 10.3.19 to Figure 10.3.22 show the comparison of calculated enthalpy with all the data in the Metallic Fuels Handbook for U-15Pu-10Zr and U-10Zr alloys, and U and Pu metals. Figure 10.3.23 to Figure 10.3.25 show the variation of U-Pu-Zr alloy fuel enthalpy with composition obtained from this subroutine. The Zr content varies from 2 to 20 wt % and the Pu content varies from 5 to 30 wt % in the U-Pu-Zr alloy fuels plotted in these figures. The solidus and liquidus temperature required as input to the HFUEL1 subroutine were calculated using the subroutine developed by Pelton [10-13].
The subroutine is used in the SAS4A/SASSYS‑1 codes by the subroutine PRECAl (see flow diagram of Figure 10.3.7), before the steady state calculation, to pre-calculate coefficient of a simplified specific heat equation to be used in the steady state and transient calculations of the codes. These coefficients or parameters are defined in Figure 10.3.18, and are pre-calculated for each fuel type that use the regionwise interpolated U-Pu-Zr thermal properties (input option IFUELM=0). This pre-calculation of the coefficients or parameters of the simplified specific heat equation should increase the computational speed of the codes. For this pre-calculation, a sufficient number of pairs of temperature and enthalpy values for the pre-transition solid U-Pu-Zr alloy (see Figure 10.3.18) are obtained from the subroutine HFUEL1. The following enthalpy equation, basically a quadratic function of temperature that is constrained to exactly reproduce the first and last pairs of values, is then fitted by the method of least squares.
(10.3‑26)
(10.3‑27)
where
\(T_{\text{i}}, h_{\text{i}}\) = ith pair of temperature and enthalpy values,
\(N\) = number of pairs of values,
\(c\) = coefficient of the quadratic term in the simplified enthalpy equation, to be determines by the method of least squares.
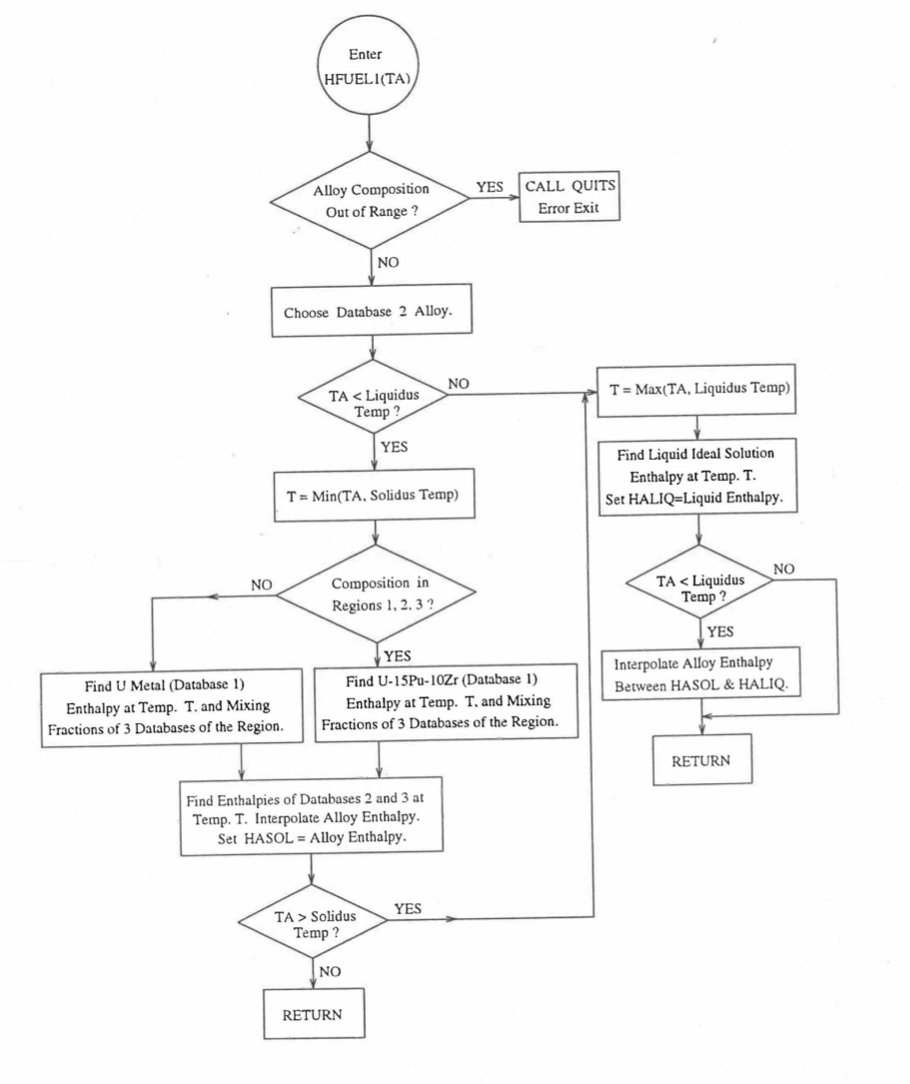
Figure 10.3.17 Flow Diagram of Subroutine HFUEL1 for U-Pu-Zr Enthalpy.
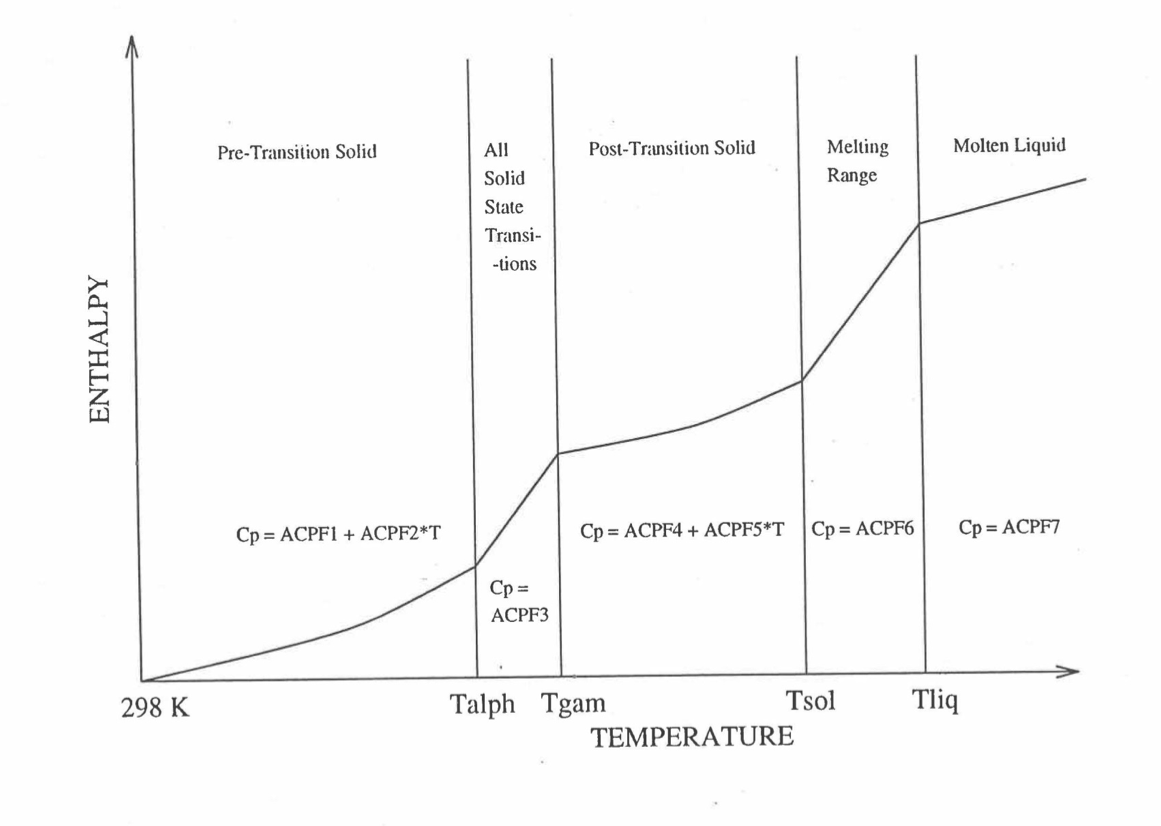
Figure 10.3.18 Diagram Showing the 9 Parameters (ACPF1 to ACPF7, and Solidus and Liquidus Temperatures) Pre-Calculated and Stored for Each U-PuZr Fuel Type for Fast Evaluation of Specific Heat.
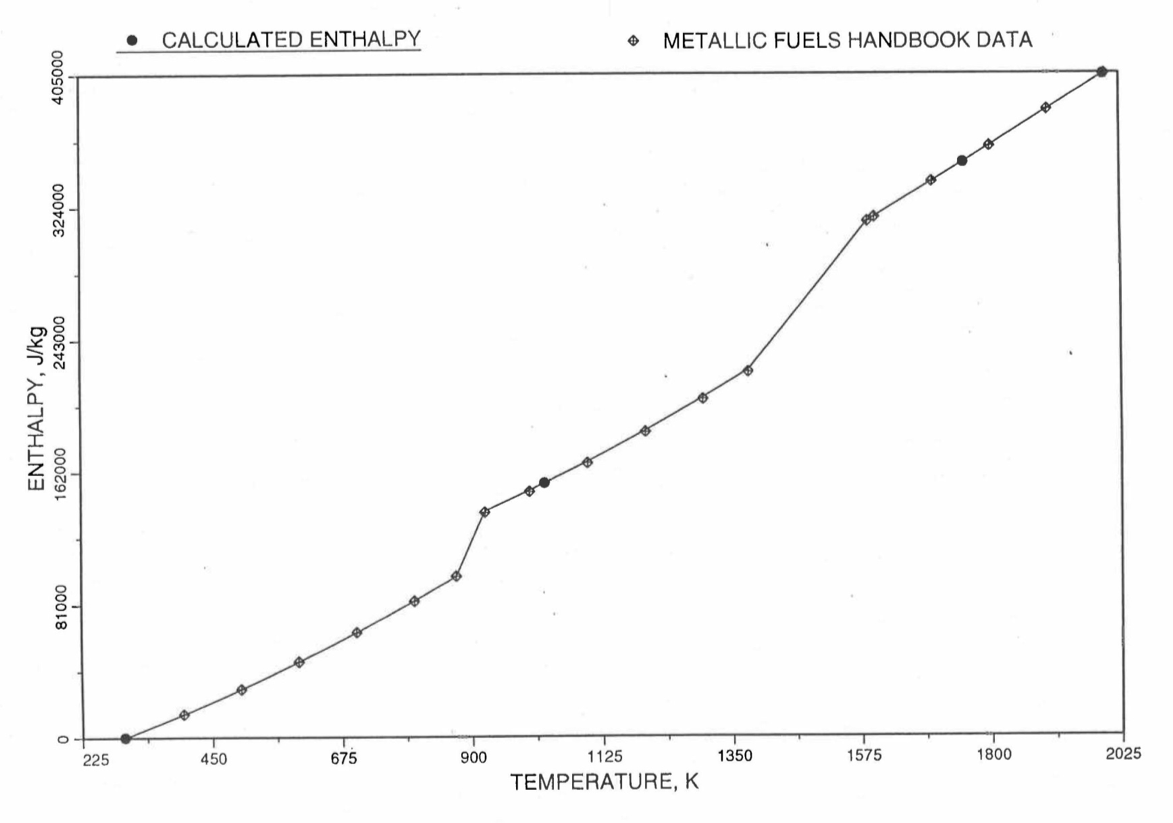
Figure 10.3.19 Comparison of Calculated Enthalpy of U-Pu-10Zr Fuel With the IFR Metallic Fuels Handbook Data.
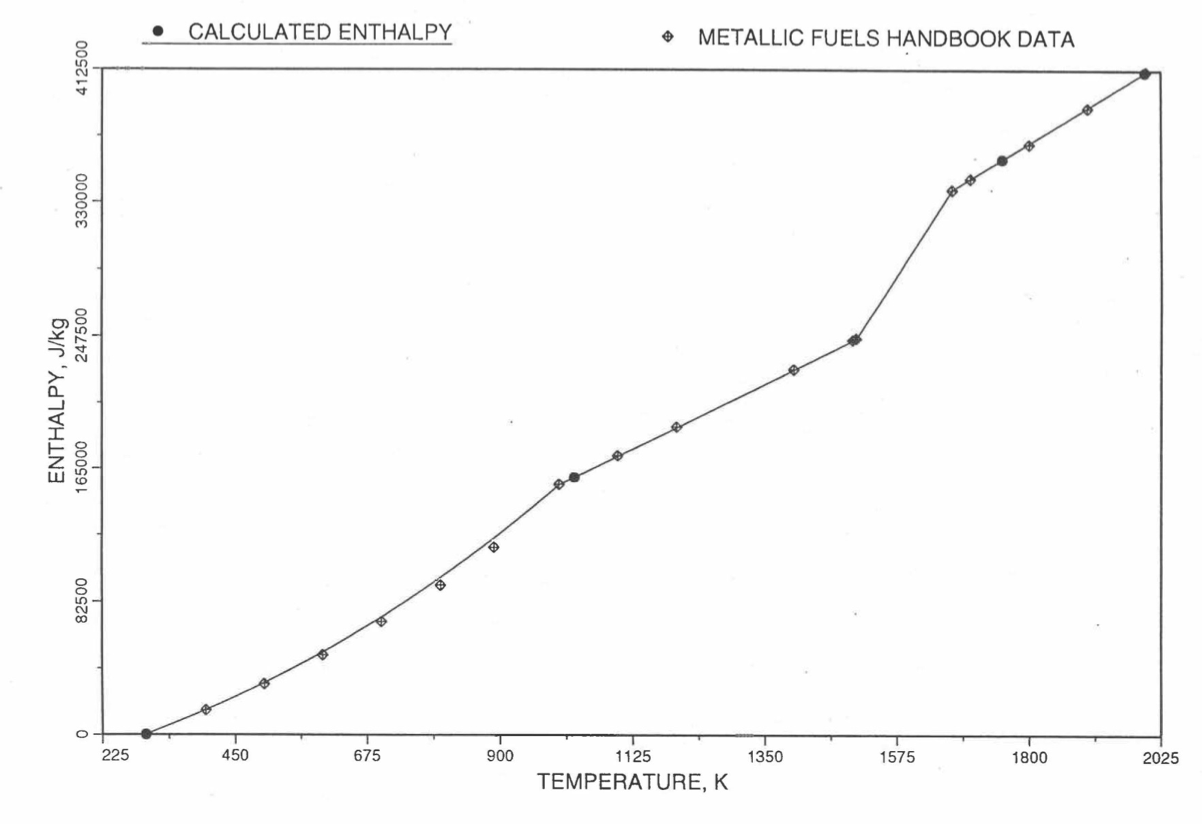
Figure 10.3.20 Comparison of Calculated Enthalpy of U-10Zr Fuel With the Handbook Data (Input KBASE to Subroutine HFUEL1-1).
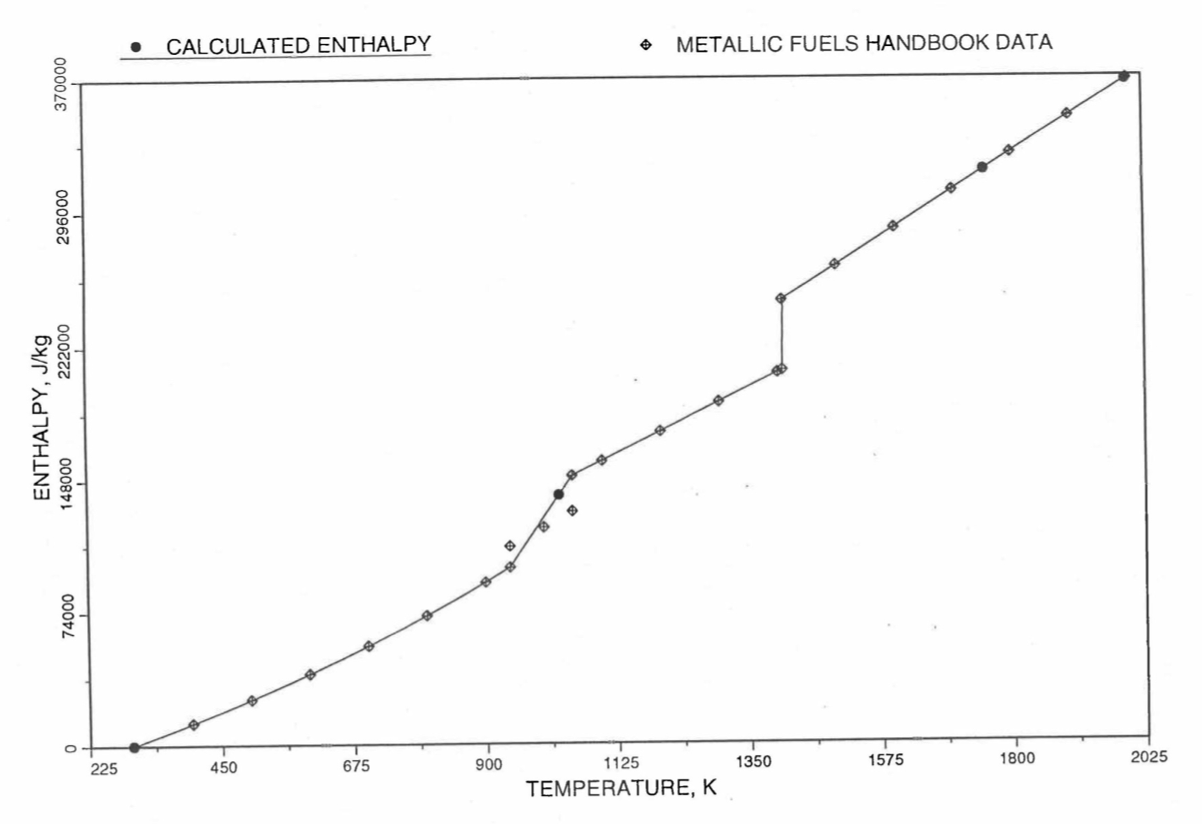
Figure 10.3.21 Comparison of Calculated Enthalpy of Uranium Metal with the IFR Metallic Fuels Handbook Data.
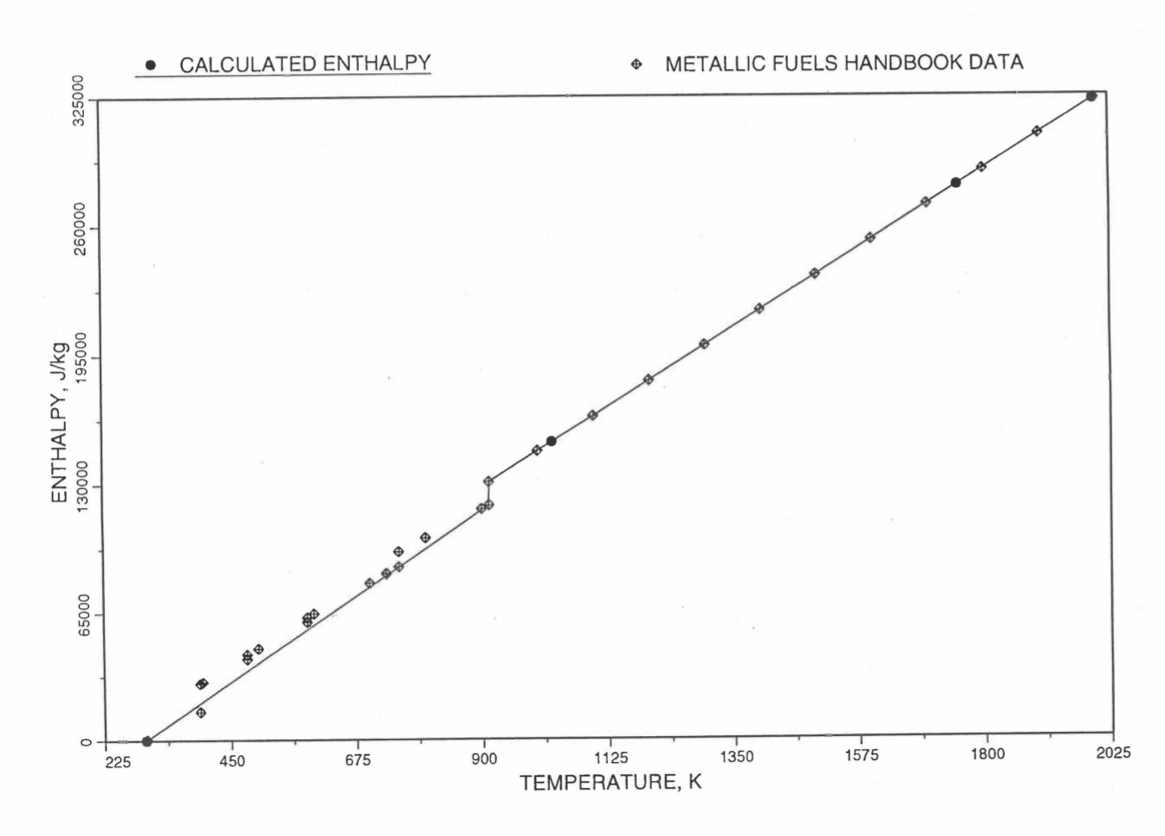
Figure 10.3.22 Comparison of Calculated Enthalpy of Plutonium Metal with the IFR Metallic Fuels Handbook Data.
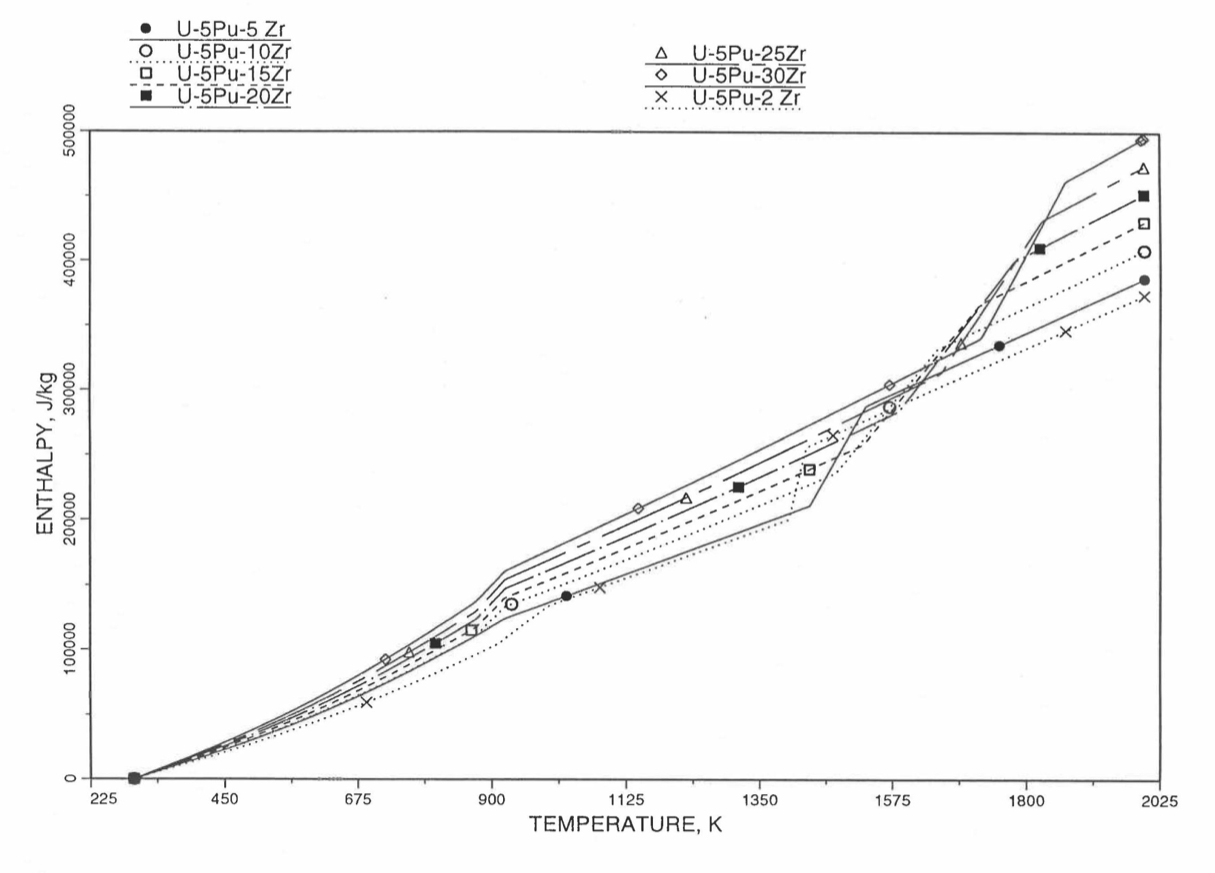
Figure 10.3.23 Variation of U-5Pu-Zr Alloy Fuel Enthalpy With Composition Obtained From Subroutine HFUEL1 Based on the Method of Regionwise Interpolation.
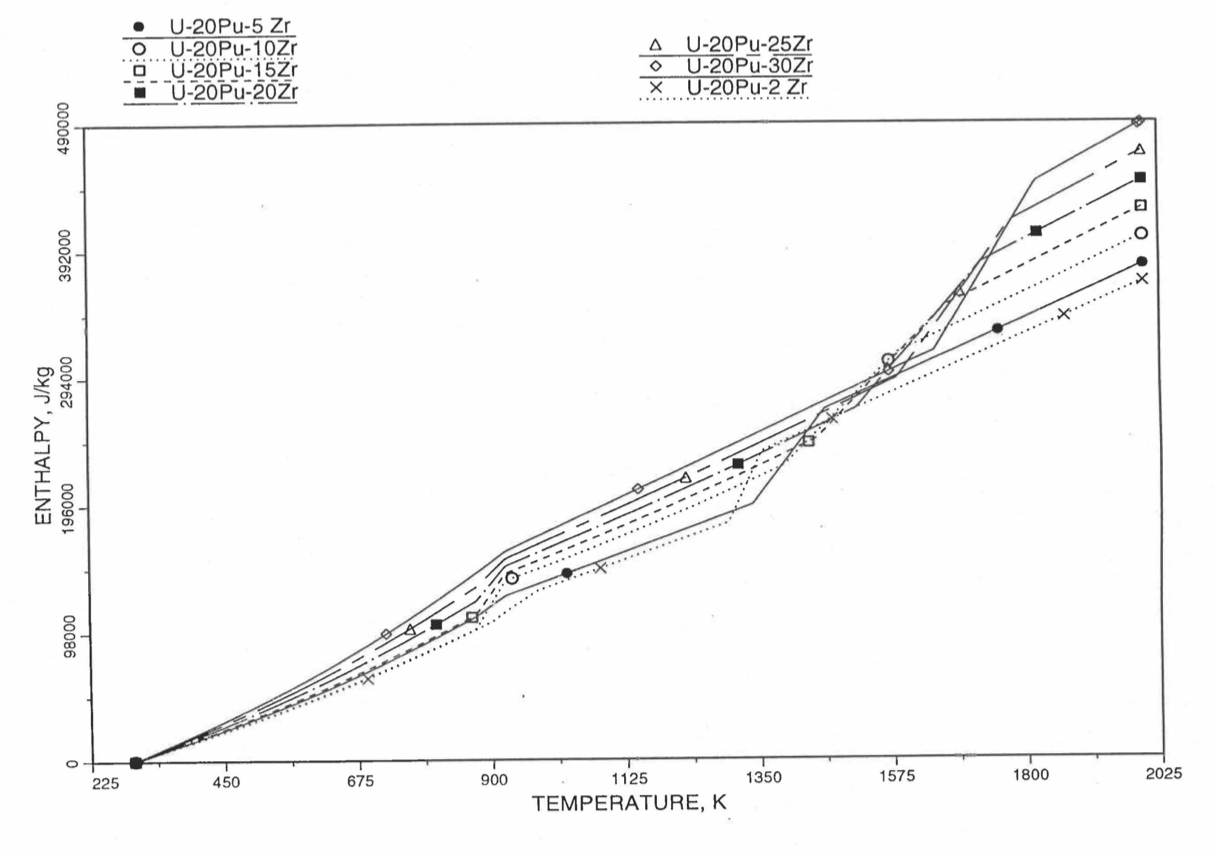
Figure 10.3.24 Variation of U-20Pu-Zr Alloy Fuel Enthalpy With Composition Obtained From Subroutine HFUEL1 Based on the Method of Regionwise Interpolation.
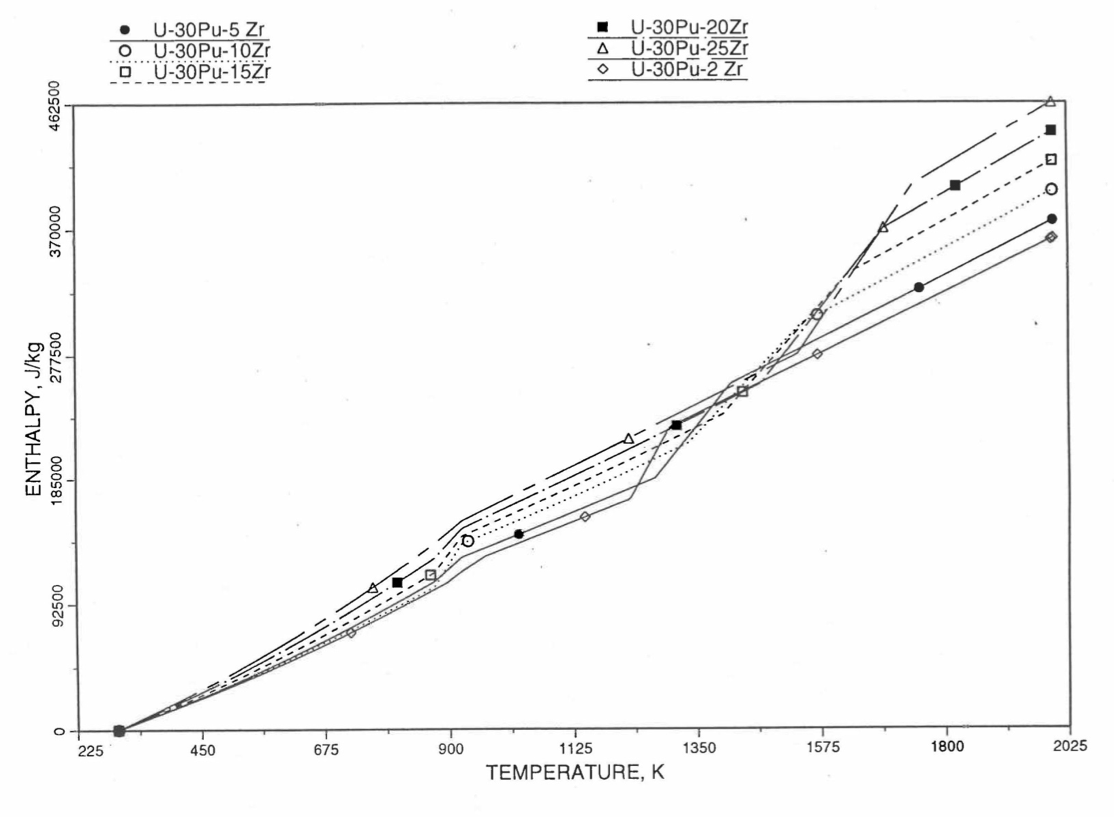
Figure 10.3.25 Variation of U-30Pu-Zr Alloy Fuel Enthalpy With Composition Obtained From Subroutine HFUEL1 Based on the Method of Regionwise Interpolation.
Minimizing the sum of squared errors, \({\sum_{\text{i} = 1}^{N}{\left\lbrack h \left( T_{\text{i}} \right) - h_{\text{i}} \right\rbrack}}^{2}\), one obtains the following value of the quadratic term coefficient.
(10.3‑28)
Differentiating Eq. (10.3-26) with respect to temperature, one obtains the following values of the coefficients of the simplified specific heat equation for the pre-transition solid U-Pu-Zr alloy (see Figure 10.3.18).
(10.3‑29)
(10.3‑30)
(10.3‑31)
The least-squares fitting procedure is repeated for the post-transition solid U-Pu-Zr alloy (see Figure 10.3.18) to obtain the coefficients its simplified specific heat equation. In each of the remaining temperature ranges of Figure 10.3.18, the specific heat is assumed to be a constant.
It is important to note that, in order to be consistent with the method of Section 3.3.5 for adjusting fuel temperature (computed without accounting for heat of fusion during the main heat transfer calculation) to account for heat of fusion at any radial mesh interval that is going through the melting range, the actual specific heat ACPF6 (see Figure 10.3.18) over the melting range is replaced in subroutine CFUEL by a value linearly interpolated between (i) the post-transition solid U-Pu-Zr specific heat at the solidus temperature, and (ii) the molten liquid solution specific heat, ACPF7, at the liquidus temperature.
This approach of calculating U-Pu-Zr fuel specific heat by fuel type is used only in case of a single radial fuel zone (IFUELC=0), or multiple (i.e., up to 3) radial fuel zones (IFUELC=1). When each fuel radial mesh interval is a unique zone of a different alloy composition (IFUELC=2), then use is made of another subroutine CFUEL1 that calculates U-Pu-Zr alloy specific heat as a function of composition, directly by regionwise interpolation of the temperature-derivative of enthalpies of database alloys, as described in the next section.
10.3.2.2. Specific Heat of U-Pu-Zr Fuel
When each fuel radial mesh interval is a unique zone of a different alloy composition (input parameter IFUELC = 2), then it is difficult to use specific heat by fuel type because only 8 fuel types are currently allowed in the SAS4A/SASSYS‑1 codes. The situation becomes even more difficult after in-pin fuel melting, and mixing of fuel radial mesh intervals in the molten fuel cavity produces new alloy compositions. In this case, use is made of another subroutine CFUEL1 that calculates U-Pu-Zr alloy specific heat as a function of composition, directly by regionwise interpolation of the temperature-derivatives of enthalpies of database alloys, given by Eqs. (10.3-2) to (10.3-8). The regionwise interpolation of the derivatives in subroutine CFUEL1 is performed following exactly the same logic as that used in the regionwise interpolation of enthalpies in the subroutine HFUEL1. This makes the two subroutines consistent. Figure 10.3.26 shows flow diagram of the subroutine CFUEL1.
The calculation begins with the evaluation of the first and last solid-state transition temperatures based on data in Table 10.3.1. The bold-boundary rectangular box in the flow diagram of Figure 10.3.26 represents the most major part of the subroutine CFUEL1, the part that performs regionwise interpolation of the temperature-derivatives of enthalpies of database alloys in the temperature range of pre-transition and post-transition solid fuels. These temperature ranges are defined in Figure 10.3.18. Between the first and last transition temperatures, the subroutine HFUEL1 is used to find the enthalpies at the first and last transition temperatures, and the fuel specific heat is set equal to the average slope of enthalpy between these two temperatures. The detailed variation of specific heat between the first and last transition temperatures was studied using a modified version of CFUEL1 and found to be small (see Figure 10.3.27 to Figure 10.3.29) and inappropriate for inclusion in the heat transfer calculation of the SAS4A/SASSYS‑1 codes. In that modified version of CFUEL1, the regionwise interpolation of derivatives represented by the bold-boundary rectangular box of Figure 10.3.26 was used instead of the average slope. At and above the liquidus temperature of the desired U-Pu-Zr alloy, the specific heat as a function of composition is evaluated by assuming the molten alloy to be an ideal solution of the 3 liquid components U, Pu and Zr. Between the solidus and liquidus temperatures of the desired U-Pu-Zr alloy, the actual specific heat (obtained by following the dashed part of the CFUEL1 flow diagram shown in Figure 10.3.26) over the melting range is replaced by a value linearly interpolated between (i) the post-transition solid U-Pu-Zr specific heat (CPSOL in Figure 10.3.26) at the solidus temperature, and (ii) the molten liquid solution specific heat (CPLIQ in Figure 10.3.26) at the solidus temperature. This replacement is required in order to be consistent with the method of Section 3.3.5 for adjusting fuel temperature (computed without accounting for heat of fusion during the main heat transfer calculation) to account for heat of fusion at any radial mesh interval that is going through the melting range.
Figure 10.3.20 shows the variation of Mark-V (U-20Pu-10Zr), U-15Pu-10Zr and U-10Zr fuel specific heats with temperature, obtained from this subroutine. Figure 10.3.31 to Figure 10.3.36 show the variation of U-Pu-Zr alloy fuel specific heat with composition. The Zr content varies from 2 to 25 wt %, and the Pu content varies from 5 to 30 wt % in the U-Pu-Zr alloy fuels plotted in these figures. Figure 10.3.32, Figure 10.3.34 and Figure 10.3.36 simply show an enlargement of the solid-stat transition region of Figure 10.3.31, Figure 10.3.33 and Figure 10.3.35. The solidus and liquidus temperatures required as input to the CFUEL1 subroutine were obtained using the subroutine developed by Pelton [10-13].
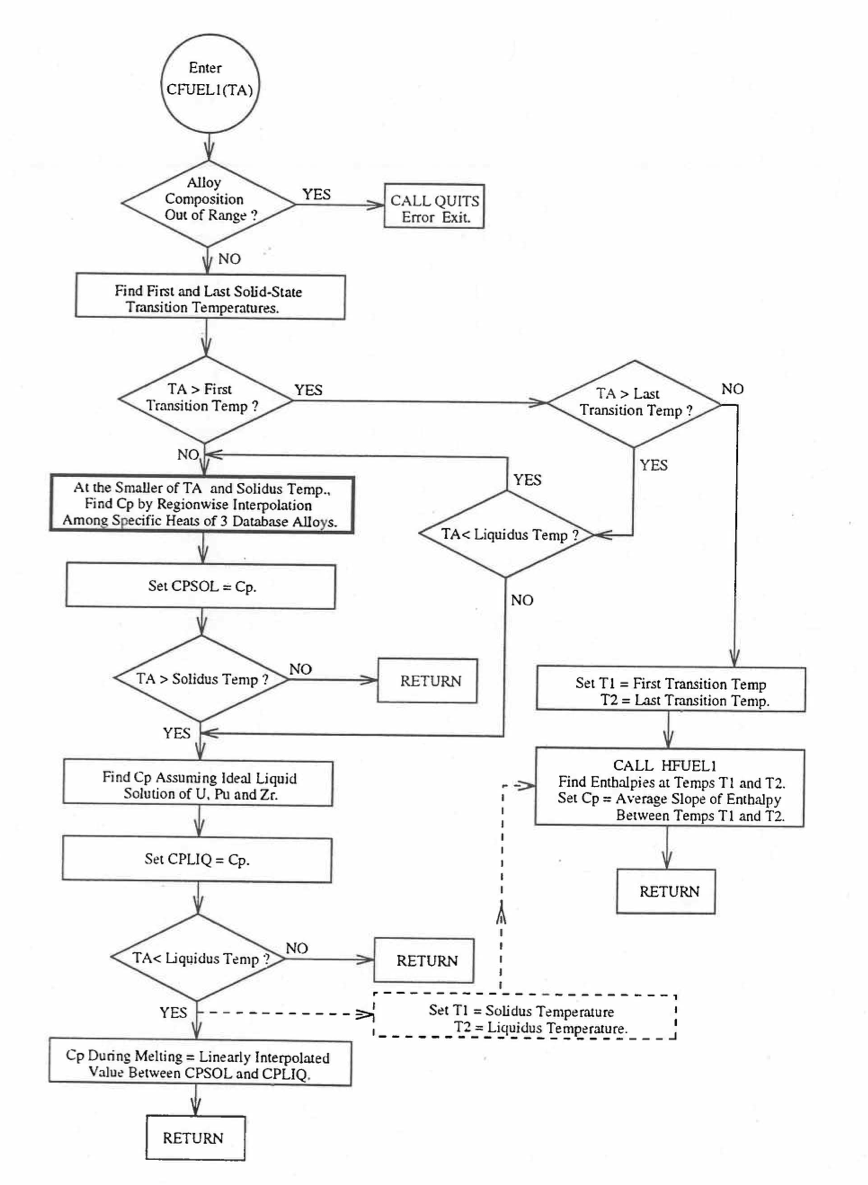
Figure 10.3.26 Flow Diagram of Subroutine CFUEL1 for U-Pu-Zr Specific Heat.
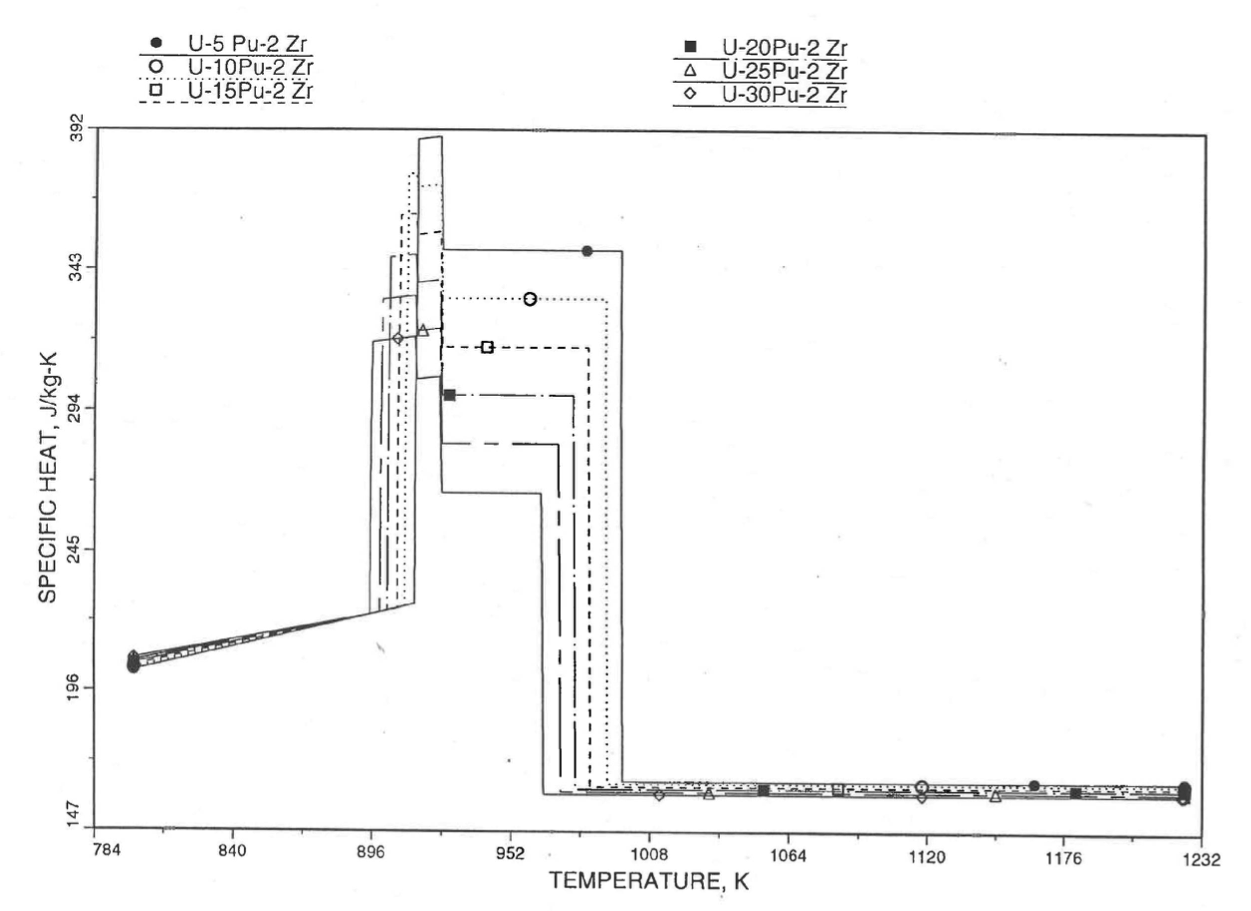
Figure 10.3.27 Detailed Variation of U-Pu-2Zr Fuel Specific Heat Obtained by Regionwise Interpolation of Metallic Fuels Handbook Data.
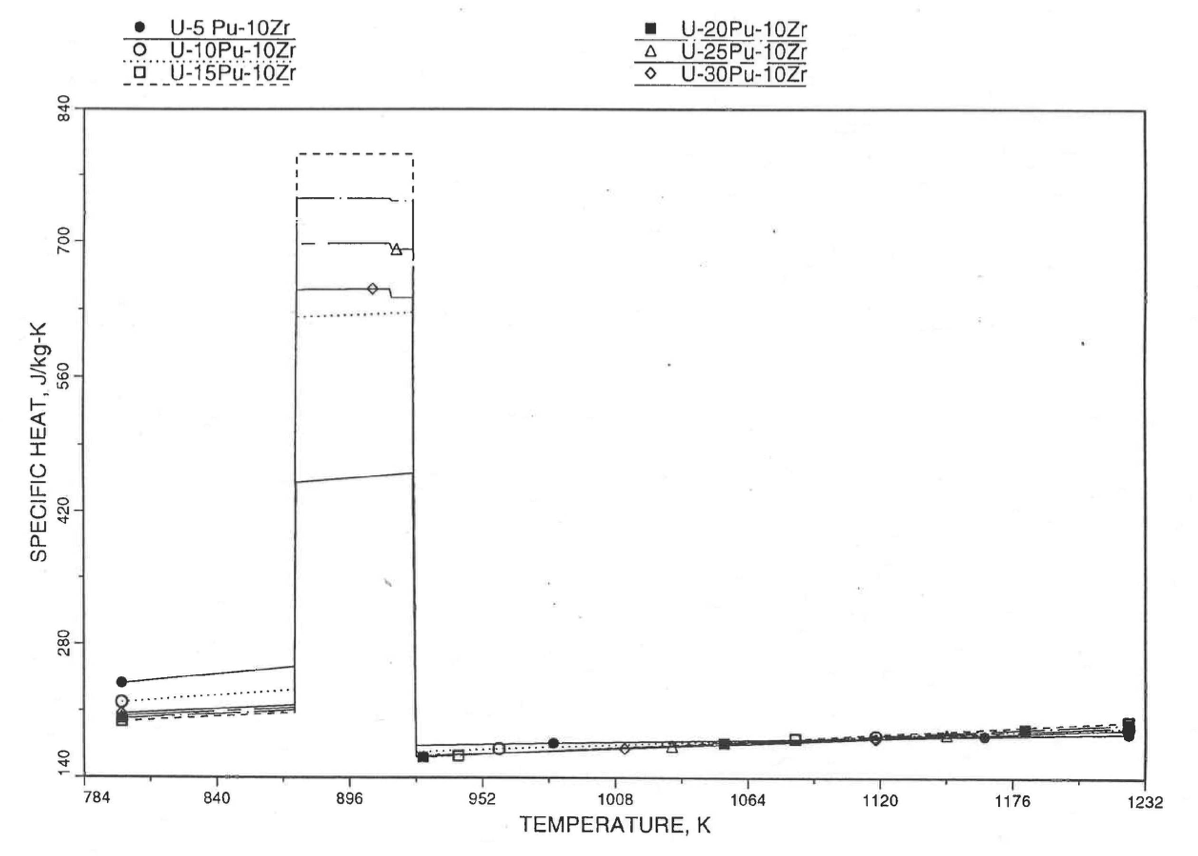
Figure 10.3.28 Detailed Variation of U-Pu-10Zr Fuel Specific Heat Obtained by Regionwise Interpolation of Metallic Fuels Handbook Data.
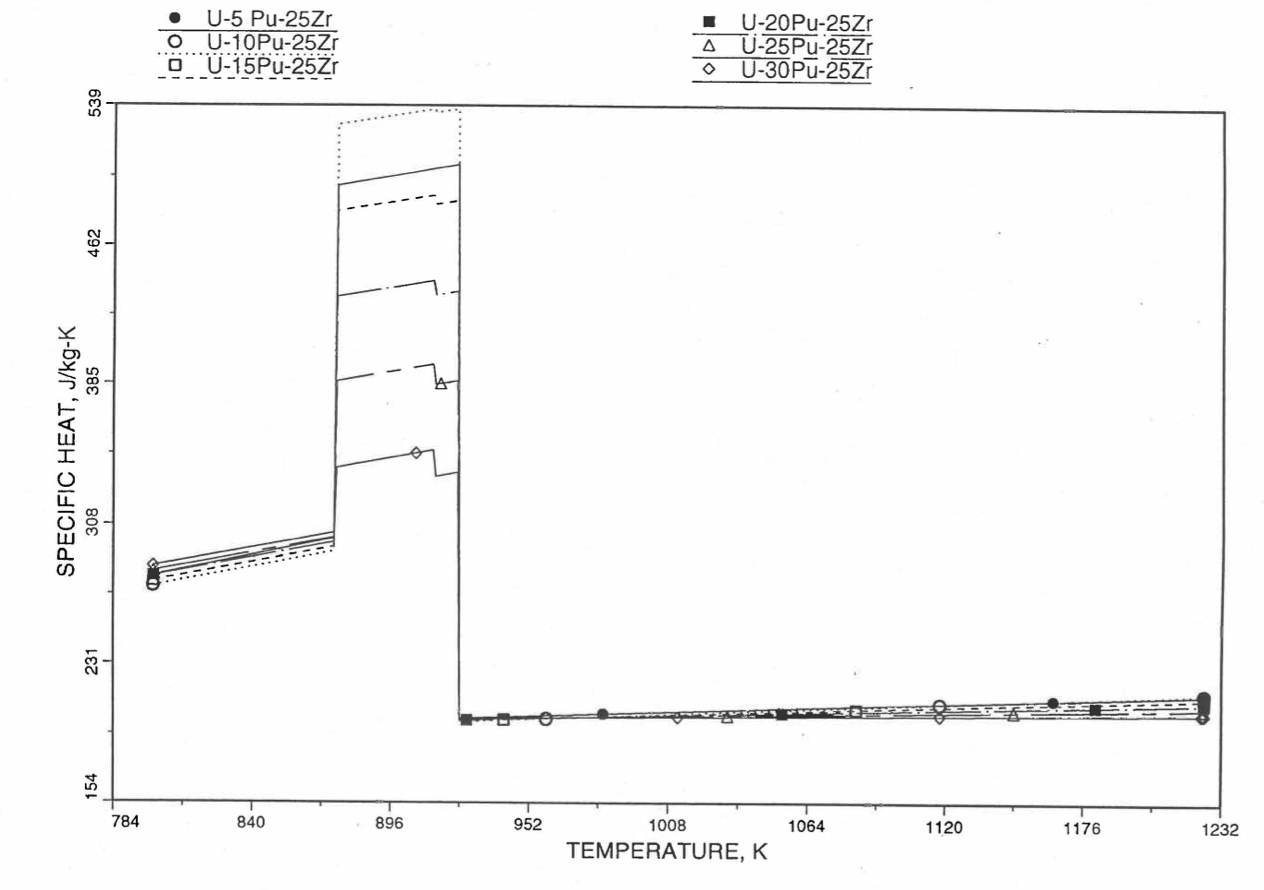
Figure 10.3.29 Detailed Variation of U-Pu-25Zr Fuel Specific Heat Obtained by Regionwise Interpolation of Metallic Fuels Handbook Data.
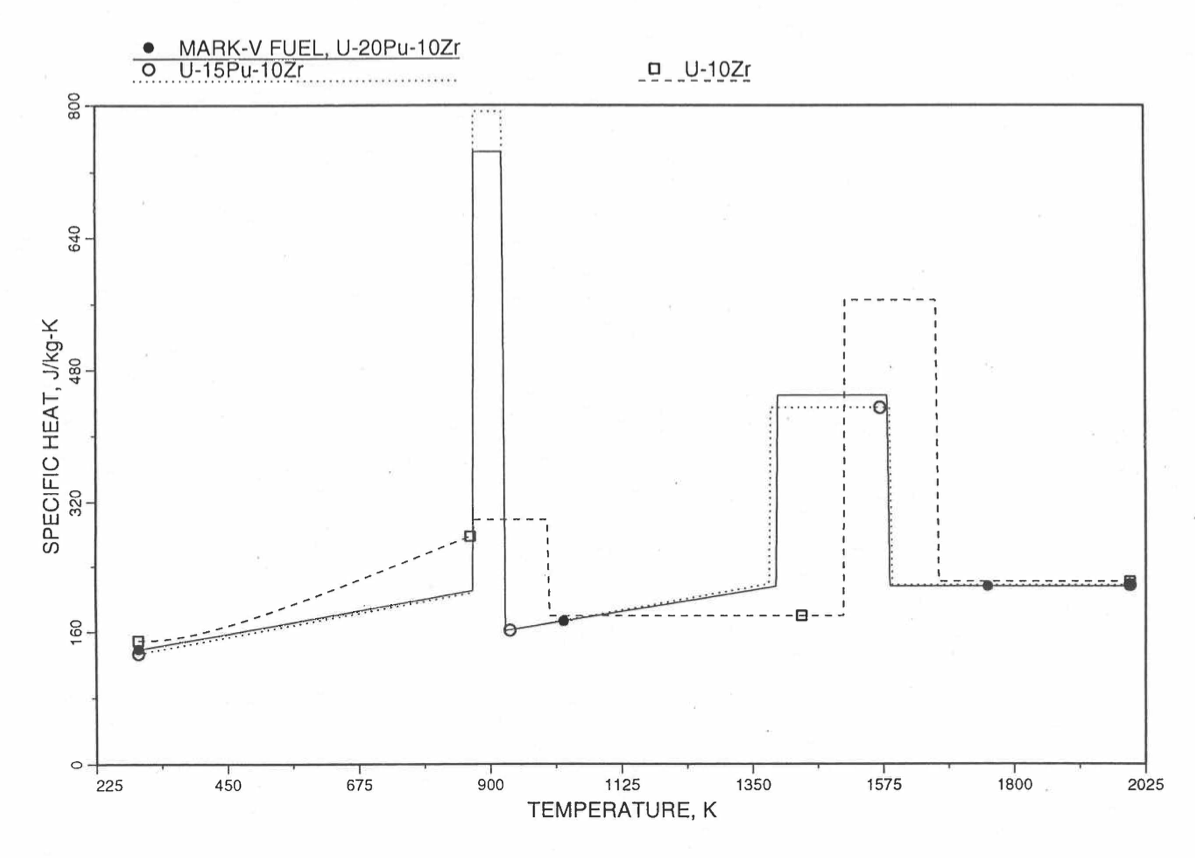
Figure 10.3.30 Specific Heat of Mark-V (U-20Pu-10Zr) Fuel Obtained by Regionwise Interpolation of Metallic Fuels Handbook Data.
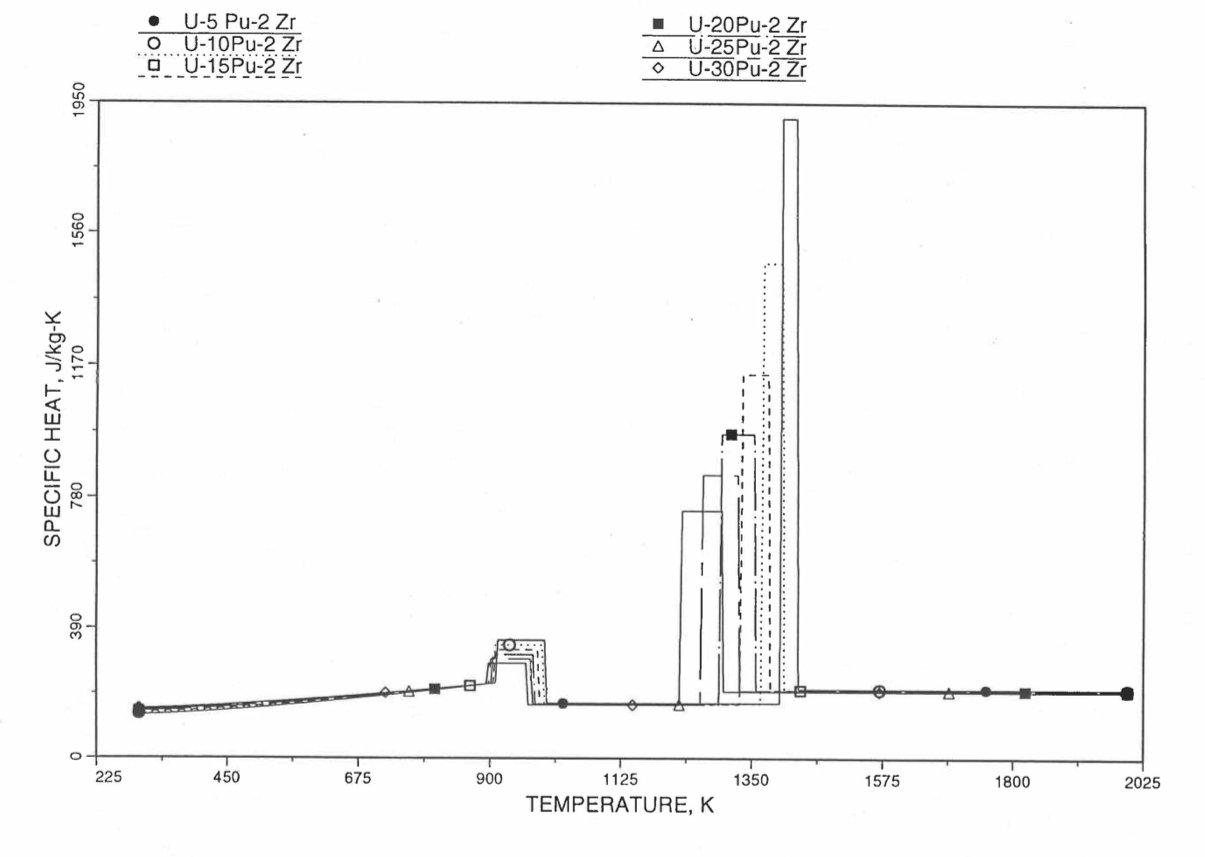
Figure 10.3.31 Specific Heat of U-Pu-2Zr Alloy Fuel Obtained By Regionwise Interpolation of Metallic Fuels Handbook Data.
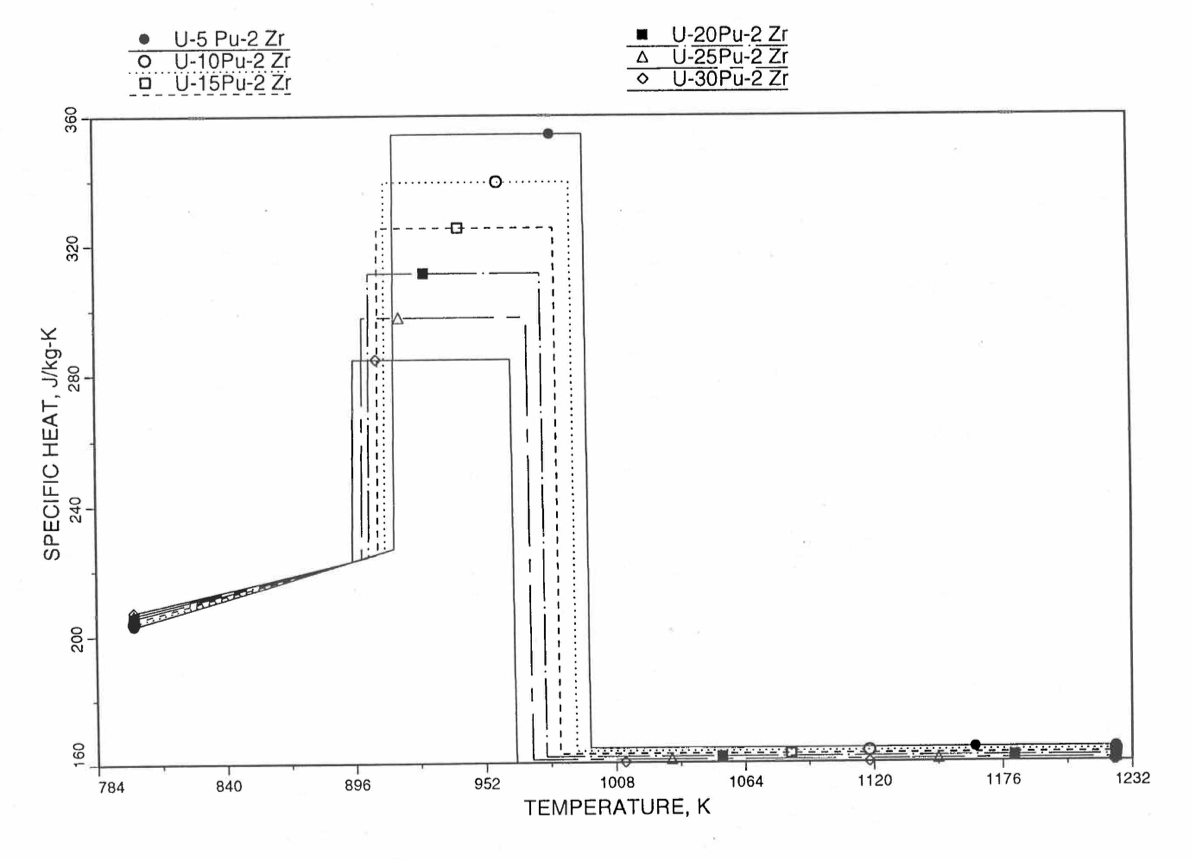
Figure 10.3.32 Specific Heat of U-Pu-2Zr Alloy Fuel Obtained by Regionwise Interpolation of Metallic Fuels Handbook Data (Enlarged).
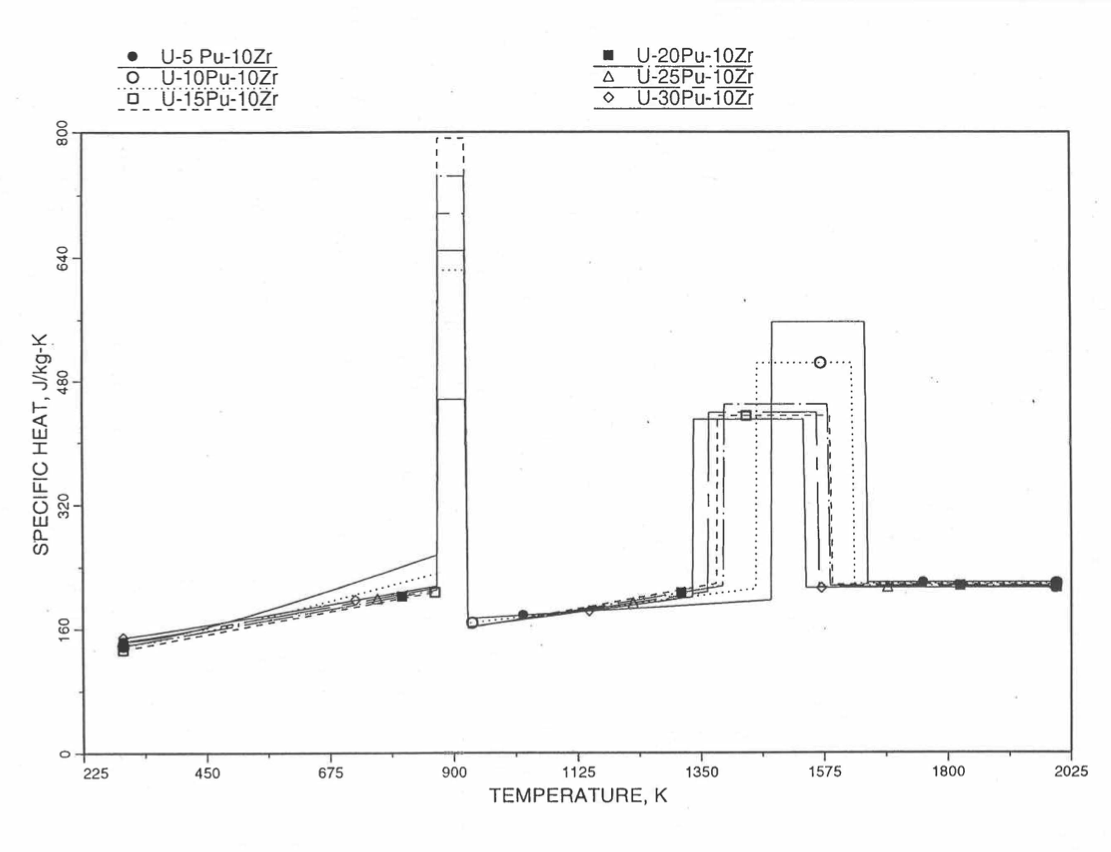
Figure 10.3.33 Specific Heat of U-Pu-10Zr Alloy Fuel Obtained by Regionwise Interpolation of Metallic Fuels Handbook Data.
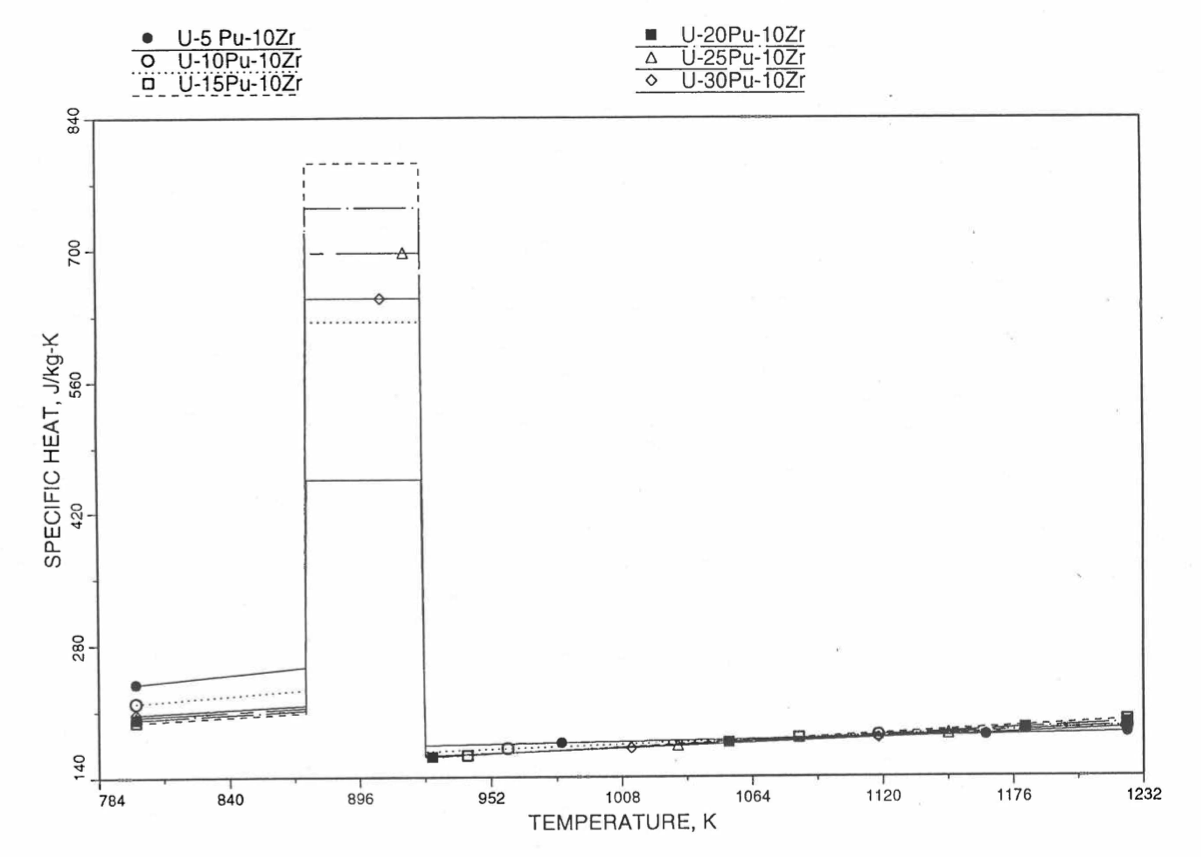
Figure 10.3.34 Specific Heat of U-Pu-10Zr Alloy Fuel Obtained by Regionwise Interpolation of Metallic Fuels Handbook Data (Enlarged).
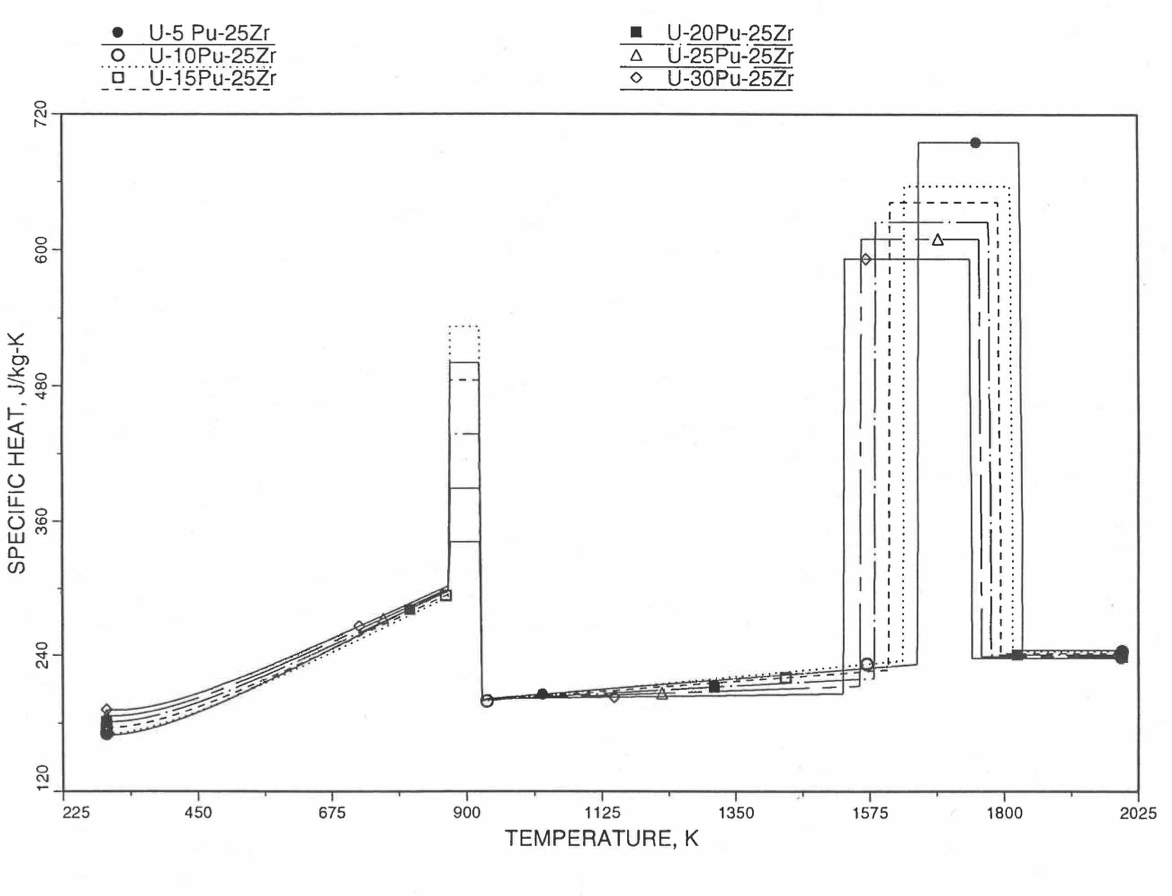
Figure 10.3.35 Specific Heat of U-Pu-25Zr Alloy Fuel Obtained by Regionwise Interpolation of Metallic Fuels Handbook Data.
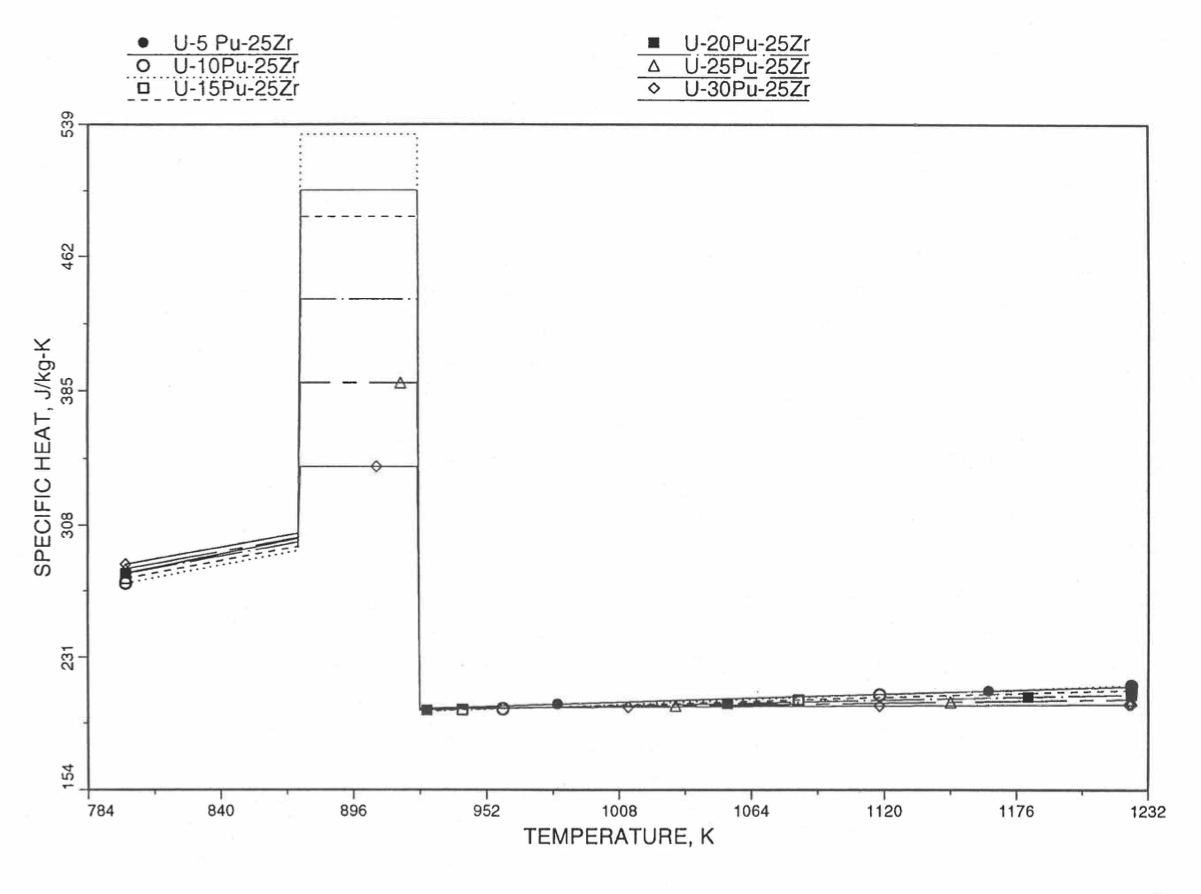
Figure 10.3.36 Specific Heat of U-Pu-25Zr Alloy Fuel Obtained by Regionwise Interpolation of Metallic Fuels Handbook Data (Enlarged).
10.3.2.3. Theoretical Density of U-Pu-Zr Fuel
10.3.2.3.1. Introduction
The IFR Metallic Fuels Handbook presents density and thermal expansion data for the 3 constituents and certain specific alloys only, and does not present correlations with their coefficients and transition temperatures as functions of composition.
Earlier, before the preparation of the Metallic Fuels Handbook [109], a method was developed to estimate the composition- and temperature-dependent theoretical density of solid U-Pu-Zr alloy fuel [10-4]. In this method, the theoretical density was first evaluated at a fixed temperature of 298K from the theoretical densities of the 3 constituents, i.e., U, Pu and Zr metals, by assuming that there is no volume change due to alloying of the constituents. This U-Pu-Zr theoretical density was adjusted for thermal expansion from 298K to the desired temperature, assuming thermal expansion to be independent of alloy composition and using the U-15Pu-10ZR alloy thermal expansion data for all alloy compositions. A drawback of this method [10-4] of estimating U-Pu-Zr theoretical density is that the dependence of thermal expansion on alloy composition is left unaccounted. Another drawback is that the data for the theoretical densities of the constituent metals and the thermal expansion of U-15Pu-10Zr were obtained from sources [10-14, 10-15] other than the Metallic Fuels Handbook.
A similar method is used in the FPIN2 code [10-11] to estimate the composition- and temperature-dependent theoretical density of U-Pu-Zr alloy fuel. The theoretical density is first evaluated at a fixed temperature of 293K from the theoretical density data in the Handbook of the 3 constituent metals, by assuming that there is no volume change due to alloying of the constituents. The U-Pu-Zr density is then adjusted for temperature difference, using a composition-independent thermal expansion data. This data is obtained simply by averaging the thermal expansion data of U-5Fs, U-10Zr and U-15Pu-10Zr. The dependence of thermal expansion on alloy composition is here also left unaccounted.
Recently, new experimental thermal expansion data for U-19Pu-10Zr and U-26Pu-10Zr alloys have been reported in the IFR Handbook [10-8]. Prompted b this new data, the method of estimating U-Pu-Zr alloy enthalpy by regionwise interpolation has been extended to estimate linear thermal expansion of U-Pu-Zr alloy fuels as a function of composition. A subroutine THEXP1 based on this method to calculate the composition-dependent thermal expansion has been developed and incorporated into the SAS4A/SASSYS‑1 codes. The subroutine makes use of the thermal expansion data of all the 8 alloys/components reported in the Handbook [10-8]. The 8 basic alloy compositions are used to divide the ternary composition triangle into 9 regions of interpolation as described in Section 10.3.2.4. The method is flexible enough to make use of the thermal expansion data of additional alloys (as they become available) to divide the composition triangle into a larger number of smaller regions, thus improving its accuracy. The U-Pu-Zr theoretical density is now adjusted for temperature difference using composition-dependent thermal expansion calculated for the desired alloy instead of using an arbitrarily assumed composition-independent thermal expansion data. Also, an approximate technique to correct the theoretical density for the presence of fission products, which remains valid even if annular composition zones have been formed due to radial redistribution of alloy constituents, has been developed and incorporated into the SAS4A/SASSYS‑1 codes. This technique is applied by a code user option.
10.3.2.3.2. Theoretical Density of U-Pu-Zr Fuel at 293K
The theoretical density of U-Pu-Zr fuel at a fixed temperature of 293K is calculated form the theoretical densities of U, Pu and Zr by assuming that there is no volume change due to alloying of the constituents. This assumption has been referred to as the ideal-solution approximation, and recommended in the IFR Handbook. The recommended theoretical densities of U, Pu and Zr at 293K are 19070, 19750 and 6570 kg/m3. The volume of one kilogram of U-Pu-Zr alloy can be found by summing the volumes of its constituents, and the reciprocal of this volume equals theoretical density.
(10.3‑32)
where
\(\rho_{\text{th}} \left( \text{Bu},T,W_{\text{p}},W_{\text{z}} \right)\) = theoretical density of U-Pu-Zr alloy at temperature T°K after a burnup of Bu atom percent, kg/m3,
\(W_{\text{u}}, W_{\text{p}}, W_{\text{z}}\) = weight fractions of U, Pu and Zr in the alloy.
Table 10.3.2 shows a comparison of all the measured densities reported in the IFR Handbook with the theoretical densities calculated using Eq. (10.3-32). The comparison gives a maximum error of 2.45% with an average error of 1.1%. The comparison is satisfactory for these alloy compositions. The small differences may be due to measurement error, small voids left during the alloy preparation or some volume change taking place during alloying. Equation (10.3-32) does not account for the effect of isotopic compositions of U and Pu on theoretical density, and some of the difference between the measured and calculated densities may be caused by this effect.
10.3.2.3.3. Correction for the Presence of Fission Products
Equation (10.3-32) gives the theoretical density of unirradiated U-Pu-Zr fuel at a fixed temperature of 293K. This section presents the effect of the presence of fission products, and the next section presents the effect of temperature on U-Pu-Zr fuel theoretical density. The effect of burnup on U-Pu-Zr fuel density was studied earlier [10-16], and the following equation for the theoretical density of irradiated fuel at a fixed temperature of 293K was obtained in terms of fabricated fuel composition and burnup.
Density, kg/m3 |
||||
|---|---|---|---|---|
No. |
Alloy |
Handbook |
Calculated Using Eq. 10.3-32 |
% Error |
1 |
U |
19070 |
19070 |
0.0 |
2 |
U-10Zr |
16020 |
16022 |
0.01 |
3 |
U-20Zr |
13810 |
13814 |
0.03 |
4 |
Zr |
6570 |
6570 |
0.0 |
5 |
U-15Pu-10Zr |
15800 |
16092 |
1.85 |
6 |
U-19Pu-10Zr |
– |
16110 |
– |
7 |
U-26Pu-10Zr |
– |
16143 |
– |
8 |
Pu |
19750 |
19750 |
0.0 |
9 |
U-20Pu-10Zr |
15730 |
16115 |
2.45 |
10 |
U-11.1Pu-6.3Zr |
16800 |
17087 |
1.71 |
11 |
U-18.5Pu-14.1Zr |
14800 |
15112 |
2.11 |
12 |
U-15Pu-6.8Zr |
16600 |
16963 |
2.19 |
13 |
U-15Pu-13.5Zr |
15000 |
15235 |
1.57 |
(10.3‑33)
where
\(W_{\text{uo}}, W_{\text{po}}, W_{\text{zo}}\) = fabricated weight fractions of U, Pu and Zr in the unirradiated U-Pu-Zr alloy,
\({W'}_{\text{u}}, {W'}_{\text{p}}, {W'}_{\text{z}}\) = weight fractions of U, Pu and Zr in the irradiated alloy after a burnup of Bu atom percent, without any radial migration of alloy constituents.
This change in alloy composition is only due to fission and breeding. The value of the fabricated alloy theoretical density required for the evaluation of the right hand side of Eq. (10.3-33) can be obtained from Eq. (10.3-32), using the fabricated weight fractions in place of the present weight fractions of the alloy.
In this section we want to express the irradiated fuel theoretical density in terms of zonal fuel composition (resulting from fission, breeding and also migration of constituents) and burnup. For this purpose, we need to know the amount of fission products the present fuel contains. During irradiation, uranium migrates to the middle radial composition zone while plutonium, zirconium and fission products migrate out of the middle radial composition zone. Thus the fuel constituents and their generated fission products do not remain together. This makes it difficult to calculate the amount of fission products mixed in a given zonal fuel composition. Lacking a modeling and calculation of the radial migration of fission products in a fuel pin, it is assumed that the fission products are uniformly distributed over the pin cross section, on a per unit U-Pu-Zr alloy post-irradiation mass basis. The total amount of fission products is obtained from the radially averaged atom percent burnup and the fabricated pin composition. Due to radial migration of heavy metal constituents, it is difficult to define a radial variation of atom percent burnup. The fabricated composition and not the irradiated (zonal0 composition is the basis of atom percent burnup reported in literature and, therefore, the fabricated composition should be used in evaluating the total amount of fission products. The number of heavy-metal atoms, \(N_{\text{ho}}\), per unit fabricated U-Pu-Zr alloy mass is given by
(10.3‑34)
where
\(a_{\text{u}}, a_{\text{p}}\) = uranium and plutonium atomic weights,
\(\text{Na} = 6.02472 \times 10^{26}\) = Avogadro’s number, molecules/kg-mole.
The number of fissions, \(N_{\text{fo}}\), per unit fabricated mass equals the product of burnup and heavy-metal atoms.
(10.3‑35)
Assuming \(a_{\text{u}} \approx a_{\text{p}}\), the mass of heavy-metals fissioned, \(M_{\text{fo}}\), per unit fabricated U-Pu-Zr alloy mass is given by
(10.3‑36)
Substituting Eq. (10.3-35), Eq. (10.3-36) becomes
(10.3‑37)
The mass of U-Pu-Zr alloy left after irradiation per unit fabricated mass is given by \(\left( 1 - M_{\text{fo}} \right)\). Therefore, the average number of fissions, \(N_{\text{f}}\), per unit U-Pu-Zr alloy post-irradiation mass is obtained by dividing Eq. (10.3-35) by \(\left( 1 - M_{\text{fo}} \right)\).
(10.3‑38)
Equation (10.3-38) determines the assumed uniform distribution of fission products over the pin cross section, on a per unit U-Pu-Zr alloy post-irradiation mass basis. As discussed above, the amount of fission products determined by Eq. (10.3-38) is used to correct U-Pu-Zr alloy theoretical density for the presence of fission products as follows.
Considering the mass-plus-energy conservation of a nuclear power reactor with negligible neutron leakage and capture in coolant and structure, all neutrons emitted by fuel are absorbed in the fuel itself. Therefore, the mass of fission products equals the mass of heavy-metals fissioned minus the mass-equivalent of fission energy released. The mass of fission products, \(M_{\text{f}}\), per unit U-Pu-Zr alloy post-irradiation mass is given by
(10.3‑39)
where
\(m_{\text{a}}\) = 1 atomic mass unit = \(1.659828 \times 10^{-27}\) kilogram,
200 = energy released per fission in MeV units,
931 = energy-equivalent (in MeV units) of 1 atomic mass unit.
Following Ref. [10-16], the volume of fission products, \(V_{\text{f}}\), per unit U-Pu-Zr alloy post-irradiation mass is given by
(10.3‑40)
where
\(v_{\text{sfp}}\) = characteristic volume of the solid fission products per fission = \(6.772565 \times 10^{-29}\) m3.
This value of \(v_{\text{sfp}}\) has been found from pure uranium swelling data to be \(4.70 \times 10^{-29}\) m3/fission over and above the characteristic volume of uranium atom [10-16]. Using Eqs. (10.3-39) and (10.3-40), the theoretical density of irradiated fuel at a fixed temperature of 293K, after correction for the presence of fission products, is obtained as
(10.3‑41)
where
\(W_{\text{u}}, W_{\text{p}}, W_{\text{z}}\) = weight fractions of U, Pu and Zr in the irradiated U-Pu-Zr alloy.
Using a value of 238 for \(a_{\text{u}}\), and noting that \(m_{\text{a}}\) is the reciprocal of Na, Eq. (10.3-41) becomes
(10.3‑42)
where
(10.3‑43)
The quantity \(f_{\text{o}}\) is the heavy-metal mass fissioned expressed as a percentage of U-Pu-Zr alloy post-irradiation mass. This approximate technique to correct the theoretical density for the presence of fission products, which remains valid even after annular zone formation (\(W_{\text{u}}, W_{\text{p}}, W_{\text{z}}\) are then zonal weight fractions) due to radial migration of alloy constituents, is incorporated into the SAS4A/SASSYS‑1 codes and is applied by a code user option.
10.3.2.3.4. Theoretical Density of Irradiated U-Pu-Zr Fuel
Equations (10.3-42) and (10.3-43) give the theoretical density of irradiated U-Pu-Zr fuel at a fixed temperature of 293K. In the next section, a method of interpolating the linear thermal expansion from 293K to any desired temperature T as a function of fuel composition is described. Using this thermal expansion, the following equation can be written for the theoretical density of irradiated U-Pu-Zr fuel at any desired temperature T:
(10.3‑44)
where
\(\Delta L \left( T, W_{\text{p}}, W_{\text{z}} \right) / L_{\text{o}}\) = linear thermal expansion from 293K to temperature T, expressed as a fraction of length \(L_{\text{o}}\) at the temperature 293K, for a U-Pu-Zr alloy with U, Pu, and Zr weight fractions equal to \(W_{\text{u}}, W_{\text{p}}\) and \(W_{\text{z}}\).
Figure 10.3.37 shows the flow diagram of a subroutine RHOFM for calculating the theoretical density, based on this method, of irradiated U-Pu-Zr alloy fuel as a function of composition and temperature. For improving the computational speed of the SAS4A/SASSYS‑1 codes, the theoretical density without fission products at 293K of each U-Pu-Zr fuel type (that uses the regionwise interpolation thermal properties, i.e., input option IFUELM = 0) is precalculated in subroutine PRECAL before steady state calculation, and used later in the steady state and transient calculation of the codes.
Figures (Figure 10.3.38) to (Figure 10.3.41) show the variation of theoretical density (without fission products) with temperature for 28 alloy compositions, calculated using Eq. (10.3-44). The thermal expansion required on the right hand side of Eq. (10.3-44) was obtained using the subroutine THEXP1 described below. The Pu and Zr contents each vary from zero to 30 at % in the alloy compositions plotted in these figures.
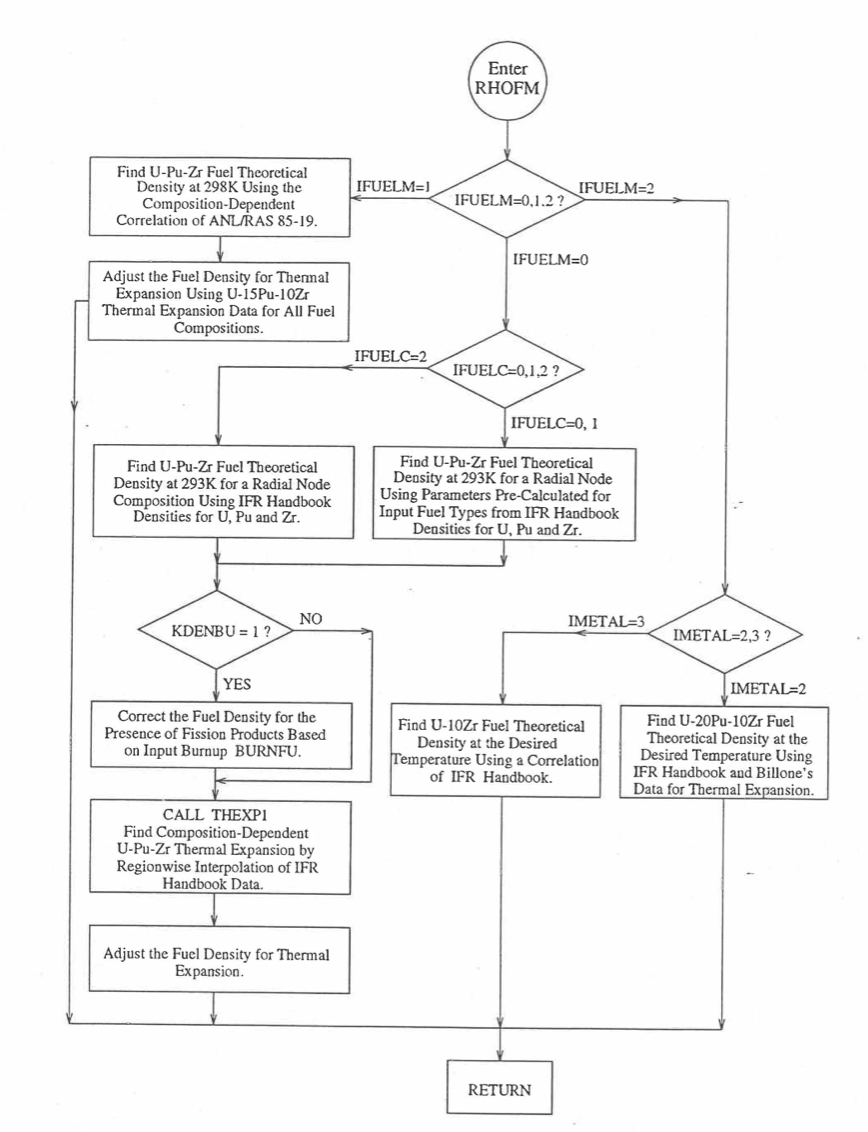
Figure 10.3.37 Flow Diagram of subroutine PHOFM for U-Pu-Zr Fuel Theoretical Density.
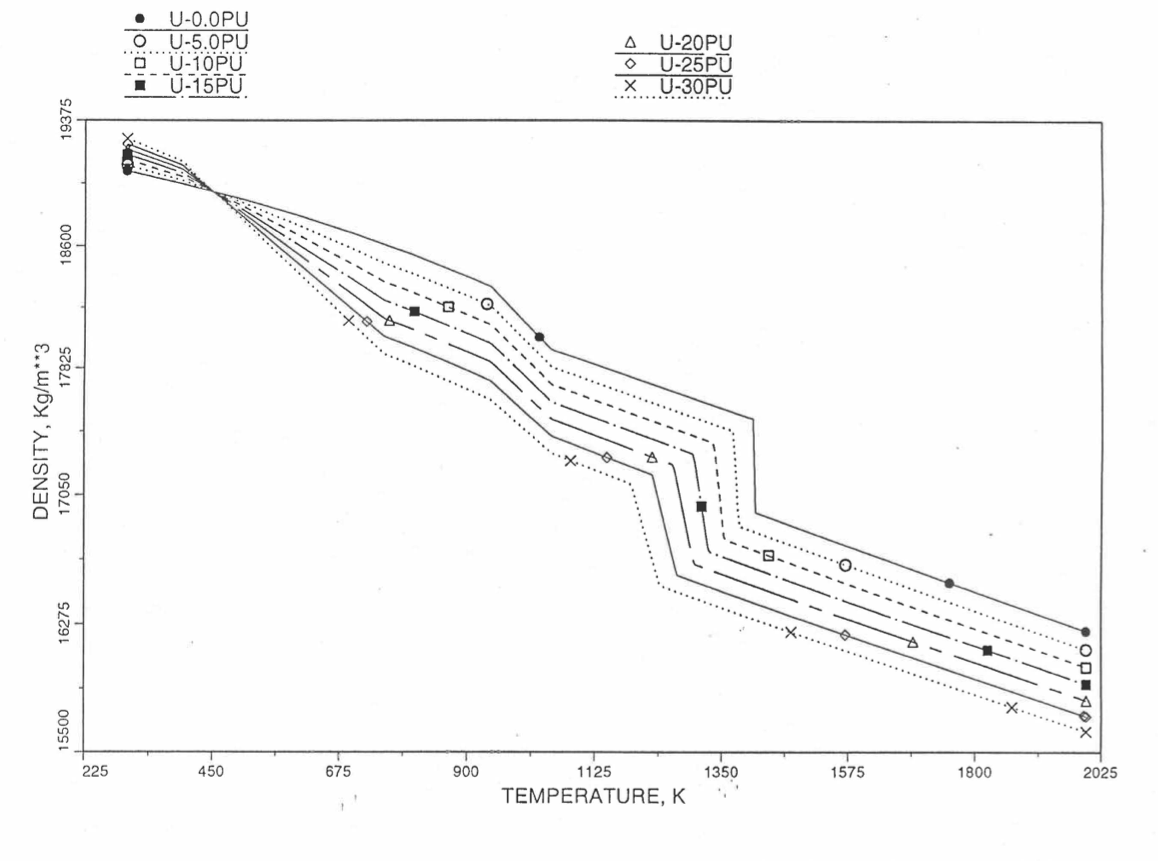
Figure 10.3.38 Theoretical Density of U-Pu Fuel Without Fission Products, Obtained from Regionwise Interpolation.
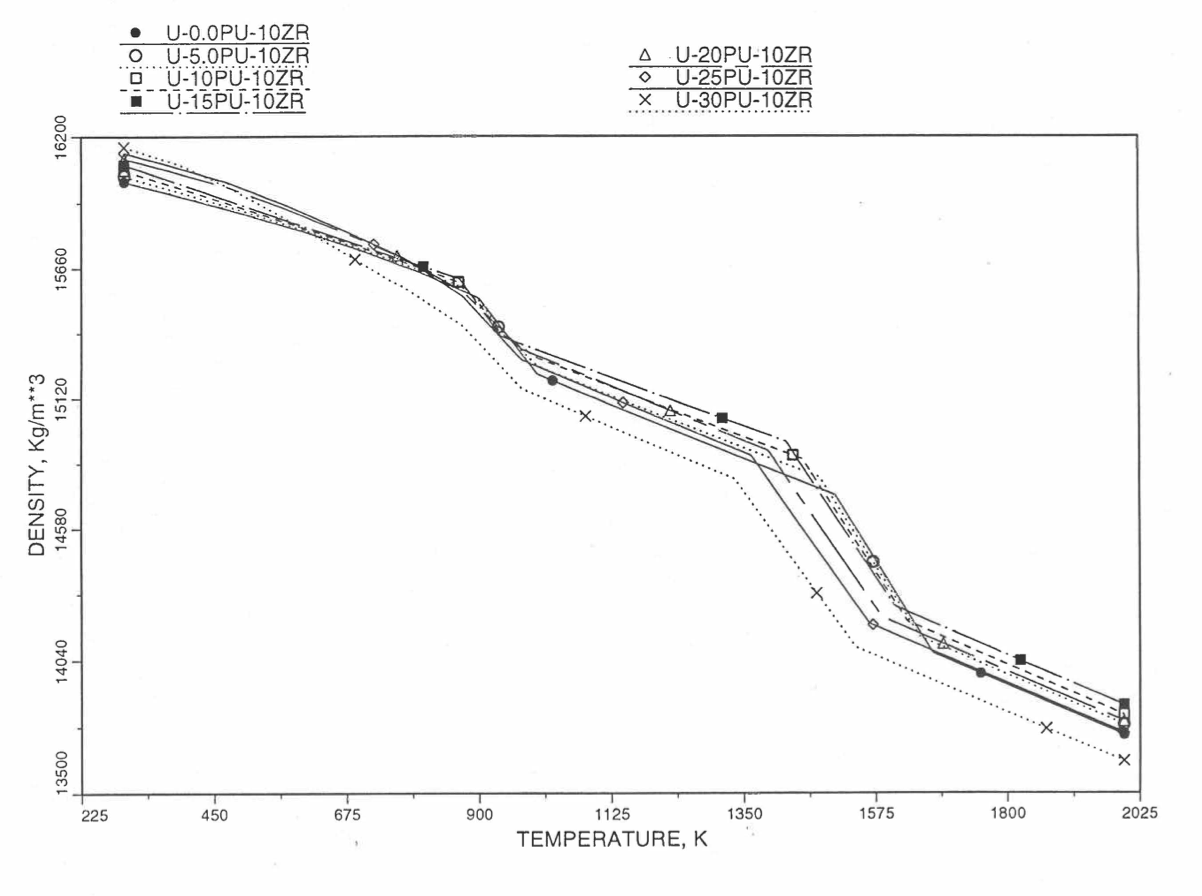
Figure 10.3.39 Theoretical Density of U-Pu-10Zr Fuel Without Fission Products, Obtained From Regionwise Interpolation of IFR Handbook Data.
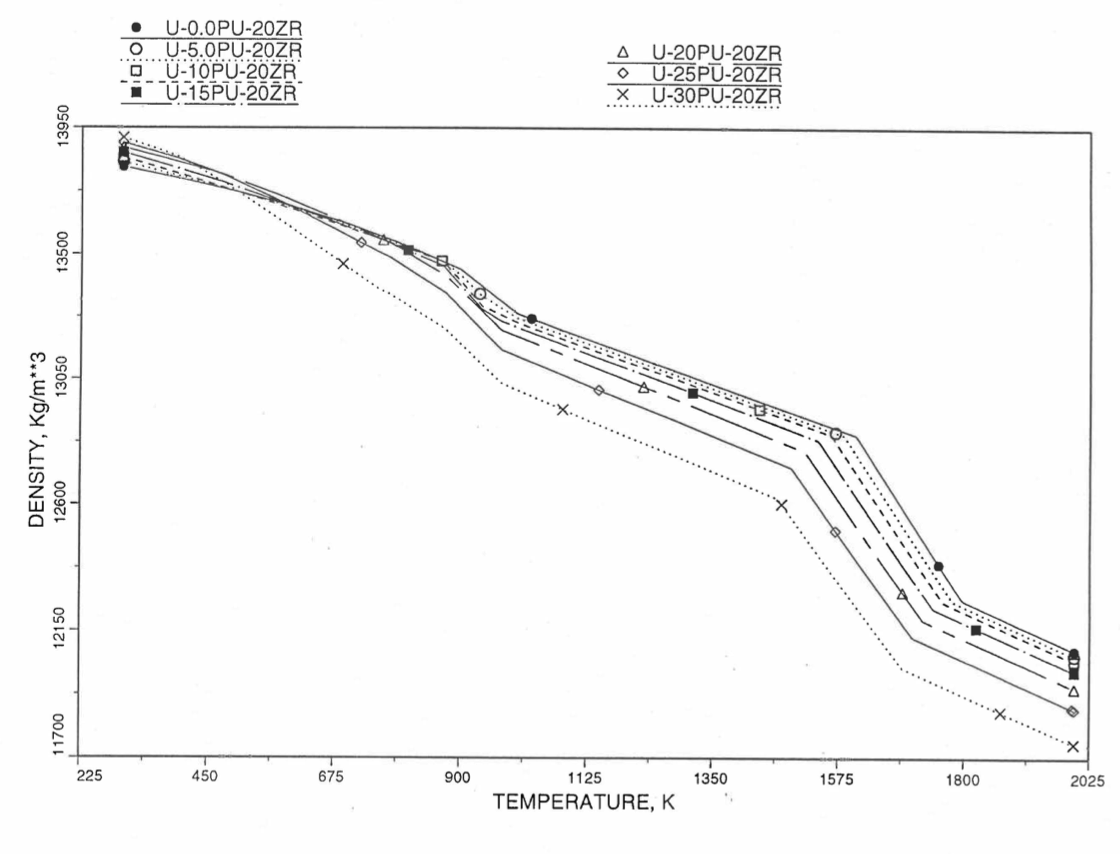
Figure 10.3.40 Theoretical Density of U-Pu-20Zr Fuel Without Fission Products, Obtained from Regionwise Interpolation of IFR Handbook Data.
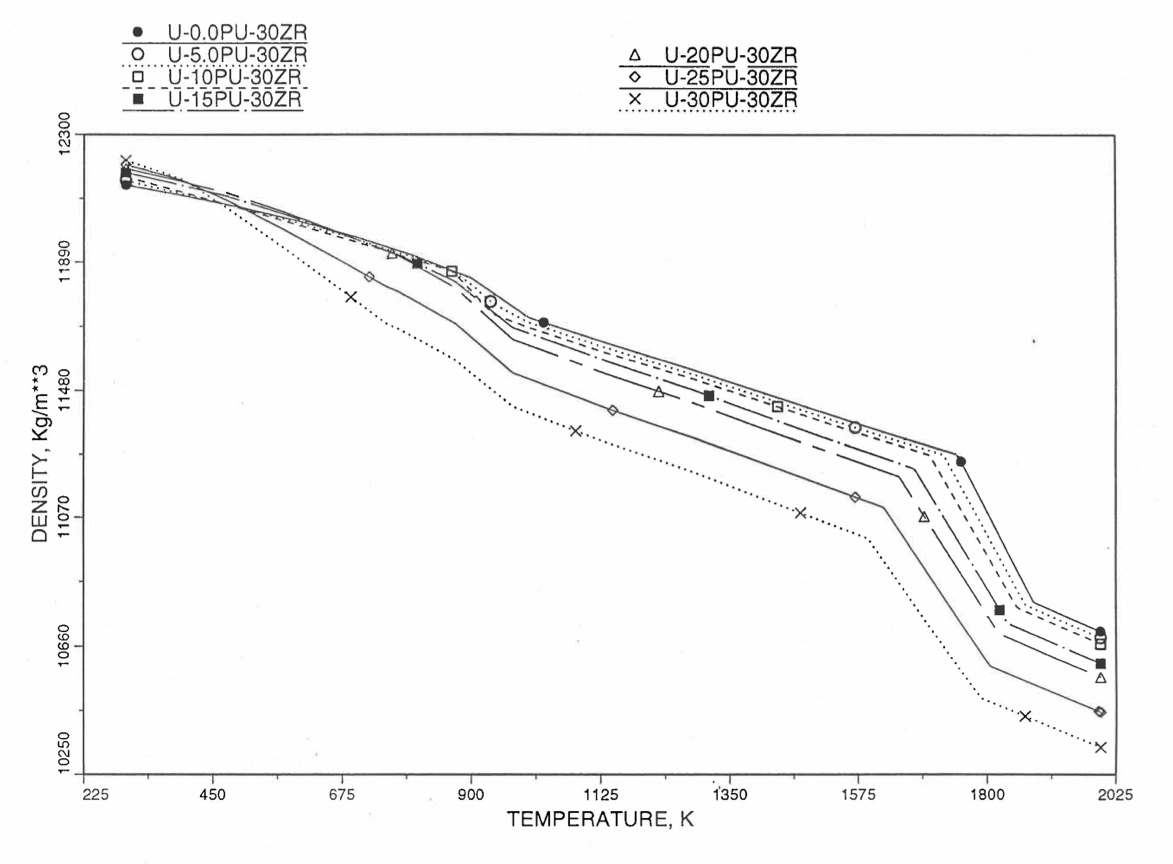
Figure 10.3.41 Theoretical Density of U-Pu-30Zr Fuel Without Fission Products, Obtained from Regionwise interpolation of IFR Handbook Data.
10.3.2.4. Thermal Expansion of U-Pu-Zr Fuel
In this section, a method of interpolating the linear thermal expansion of U-Pu-Zr fuel form 293K to any desired temperature T as a function of fuel composition is described. Only the U, Pu and Zr weight fractions are considered and the effect of fission products on thermal expansion is ignored. This thermal expansion is used in the evaluation of theoretical density of irradiated U-Pu-Zr fuel at any desired temperature, as explained in Section 10.3.2.3.
10.3.2.4.1. Description of the Method
Figure 10.3.42 shows the U-Pu-Zr ternary composition triangle marked with the points representing all the 8 alloys/components for which thermal expansion data re reported in the IFR Handbook [10-8]. The composition points of these 8 database alloys/components are used to divide the whole ternary composition triangle into 9 triangular regions of interpolation. For evaluating the linear thermal expansion of a desired solid U-Pu-Zr alloy represented by a point located in any region of interpolation, the method consists of mixing the 3 database alloys represented by the corners of the region of interpolation. The proportions or weight fractions of the 3 database alloys in mixing are so calculated in the method that the resulting mixture has the composition of the desired alloy. The calculated mixing fractions are then used as weight factors in making a linear combination of (or liner interpolation between) thermal expansions of the 3 database alloys corresponding to the desired temperature, and the value of the linear combination is the interpolated thermal expansion of the desired alloy. It should be noted that the calculated mixing fractions are never negative and the linear combination never requires extrapolation because the desired alloy composition point is always inside the triangle with corners at the 3 database alloy points. If the desired alloy composition point were outside this triangle, the linear combination would involve negative mixing fractions and extrapolation which are avoided entirely in the present method.
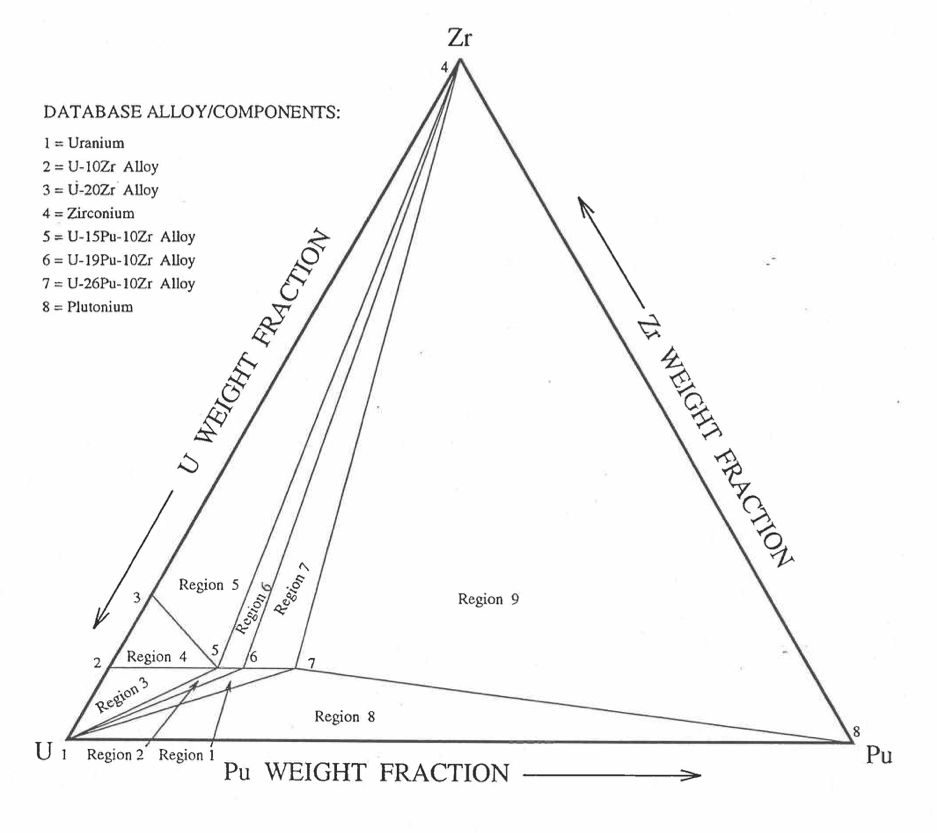
Figure 10.3.42 Diagram Showing Thermal Expansion Interpolation Regions for Solid U-Pu-Zr Alloy Fuels.
10.3.2.4.2. Thermal Expansion Data of Basic Alloys
Table 10.3.3 gives the linear thermal expansion data of the 8 basic solid alloys or components that are used in the present method of evaluating composition-dependent thermal expansion of a U-Pu-Zr alloy. The 8 basic alloys/components are: (1) U metal, (2) U-10Zr, (3) U-20Zr, (4) Zr metal, (5) U-15Pu-10Zr, (6) U-19Pu-10Zr, (7) U-26Pu-10Zr, and (8) Pu metal. The data have all been taken from the Metallic Fuels Handbook [10-8] with the modification that the thermal expansion data of U, Pu and Zr metals between their first and last solid-state transition temperatures are not included in Table 10.3.3, and not used in the present method. The thermal expansion data of U, Pu and Zr metals at their first and last transition temperatures are included in Table 10.3.3, and the thermal expansion is assumed to vary linearly with temperature between the first and last transition temperatures. This is reasonable because the sharp jumps (i.e., discontinuities) in thermal expansion data of U, Pu and Zr metals, over the temperature range of solid-state transitions, are not exhibited by alloys. The value of thermal expansion at 2500K shows in Table 10.3.3, for each database alloy/component has been obtained from the Handbook data for percent thermal expansion and coefficient of thermal expansion at the highest temperature available. A warning message is printed by the SAS4A/SASSYS1 codes if the thermal expansion value at 2500K of any database alloy is ever used in computation. The uranium thermal expansion data at 1500K, 1600K and 2500K (above its melting point) in Table 10.3.3 have been obtained by subtracting the thermal expansion due to melting (i.e., 1.14%) from the data given in the Handbook. This is done because the data in Table 10.3.3 is used in the present method to interpolate the thermal expansion of a desired U-Pu-Zr alloy up to its solidus temperature only. The evaluation of thermal expansion above the solidus temperature is described below in Section D.
10.3.2.4.3. Method of Interpolation
The method of interpolation to evaluate the linear thermal expansion of a U-Pu-Zr fuel composition at and below its solidus temperature consists of first determining the region of the ternary composition triangle (shown in Figure 10.3.42) in which the desired fuel composition lies, and then finding the weight fractions in which the 3 database alloys of the region are required to be mixed to obtain the desired fuel composition. From the mass balance of U, Pu and Zr, the following equations have been obtained in Section 10.3.2.1 for the mixing fractions, \(X_{\text{i}}\), of the database alloys that are assumed to be numbered 1, 2 and 3:
|
|
|
|
|
|
|
|
|||||||||
|---|---|---|---|---|---|---|---|---|---|---|---|---|---|---|---|---|
No. |
Temp, K |
\(\Delta L/L_{\text{o}}\), % |
Temp, K |
\(\Delta L/L_{\text{o}}\), % |
Temp, K |
\(\Delta L/L_{\text{o}}\), % |
Temp, K |
\(\Delta L/L_{\text{o}}\), % |
Temp, K |
\(\Delta L/L_{\text{o}}\), % |
Temp, K |
\(\Delta L/L_{\text{o}}\), % |
Temp, K |
\(\Delta L/L_{\text{o}}\), % |
Temp, K |
\(\Delta L/L_{\text{o}}\), % |
1 |
293 |
0 |
293 |
0 |
293 |
0 |
293 |
0 |
293 |
0 |
293 |
0 |
293 |
0 |
293 |
0 |
2 |
400 |
0.157 |
400 |
0.142 |
400 |
0.107 |
400 |
0.06 |
400 |
0.18 |
373 |
0.103 |
373 |
0.108 |
350 |
0.279 |
3 |
500 |
0.315 |
500 |
0.281 |
500 |
0.219 |
500 |
0.123 |
500 |
0.356 |
473 |
0.242 |
473 |
0.253 |
395 |
0.502 |
4 |
600 |
0.494 |
600 |
0.433 |
600 |
0.348 |
600 |
0.192 |
600 |
0.532 |
573 |
0.431 |
573 |
0.455 |
753 |
6.287 |
5 |
700 |
0.697 |
700 |
0.603 |
700 |
0.5 |
700 |
0.265 |
700 |
0.708 |
673 |
0.638 |
673 |
0.683 |
800 |
6.459 |
6 |
800 |
0.924 |
800 |
0.799 |
800 |
0.681 |
800 |
0.343 |
800 |
0.884 |
773 |
0.86 |
773 |
0.924 |
2500 |
12.68 |
7 |
900 |
1.186 |
900 |
1.027 |
900 |
0.899 |
900 |
0.442 |
868 |
1.004 |
873 |
1.146 |
873 |
1.276 |
||
8 |
941 |
1.3 |
1000 |
1.725 |
1000 |
1.3 |
1000 |
0.505 |
938 |
1.524 |
973 |
1.662 |
973 |
1.868 |
||
9 |
1048 |
2.05 |
1100 |
1.95 |
1100 |
1.487 |
1100 |
0.586 |
1000 |
1.649 |
1073 |
1.881 |
1073 |
2.095 |
||
10 |
1100 |
2.168 |
1200 |
2.175 |
1200 |
1.674 |
1137 |
0.617 |
1100 |
1.85 |
1173 |
2.104 |
1173 |
2.327 |
||
11 |
1200 |
2.398 |
2500 |
5.1 |
2500 |
4.105 |
1284 |
0.617 |
1200 |
2.051 |
1273 |
2.334 |
1233 |
2.464 |
||
12 |
1400 |
2.855 |
1400 |
0.725 |
1300 |
2.252 |
2500 |
5.113 |
2500 |
5.386 |
||||||
13 |
1408 |
2.866 |
1600 |
0.922 |
1378 |
2.409 |
||||||||||
14 |
1500 |
3.092 |
1800 |
1.138 |
2500 |
4.664 |
||||||||||
15 |
1600 |
3.362 |
2500 |
1.803 |
||||||||||||
16 |
2500 |
5.657 |
(10.3‑45)
(10.3‑46)
(10.3‑47)
(10.3‑48)
(10.3‑49)
where
\(W_{\text{ui}}, W_{\text{pi}}, W_{\text{zi}}\) = weight fractions of U, Pu and Zr in database alloy I of the region in which the desired fuel compositions lies,
\(W_{\text{u}}, W_{\text{p}}, W_{\text{z}}\) = weight fractions of U, Pu and Zr in the desired fuel composition.
The sum of \(X_{1}, X_{2}\) and \(X_{3}\) is always 1. In case of interpolation, the values of \(X_{1}, X_{2}\) and \(X_{3}\) are always positive. If any extrapolation were involved, the value of at least one weight fraction would be negative which is entirely avoided in the present method. The linear thermal expansion of the desired U-Pu-Zr fuel composition from 293K to a temperature T at or below its solidus is then evaluated by mass-weighted averaging of the thermal expansions of the 3 database alloys from 293K to the same temperature T.
(10.3‑50)
where
\(\frac{\Delta L_{\text{i}}}{L_{\text{o}}}\) = linear thermal expansion from 293K to temperature T of the database alloy i of the region in which the desired fuel composition lines.
10.3.2.4.4. Thermal Expansion During and After Melting
Thermal expansion data during and after melting is available for none of the database alloys except uranium metal. Therefore, the thermal expansion of all alloy compositions above their solidus temperatures is evaluated using the uranium metal data, and a warning message is printed by the SAS4A/SASSYS‑1 codes if this is ever required in computation. The linear thermal expansion of uranium during melting at 1408K reported in the Handbook [10-8] is 1.14%, and the coefficient of linear expansion of molten uranium is 25.5 x 10⁻⁶/K. In the present method, the post-solidus uranium thermal expansion is added to Eq. (10.3-50) to obtain the following equation for estimating the linear thermal expansion form 293K to a temperature T above the solidus of the desired alloy:
(10.3‑51)
where
\(T_{\text{s}}, T_{\text{l}}\) = solidus and liquidus temperatures of the desired alloy.
The fourth term on the right hand side is basically the product of alloy melt fraction and uranium thermal expansion during melting phase change, and the fifth term is an estimate of the molten alloy thermal expansion due to temperature rise above the alloy solidus.
10.3.2.4.5. Subroutine THEXP1 and its Comparison With the Handbook Data
Figure 10.3.43 shows flow diagram of the subroutine THEXP1 developed for calculating the linear thermal expansion, based on this method of regionwise interpolation, of U-Pu-Zr fuel as a function of composition. This subroutine is used, in the SAS4A/SASSYS‑1 codes, in the calculation of the theoretical density as a function of temperature and composition, given by Eq. (10.3-44).
Figure 10.3.44 to Figure 10.3.51 show the comparison of calculated linear thermal expansion with all the data in the Metallic Fuels Handbook [10-8] for the 8 basic alloys or components discussed in Section B. It can be noted in Figure 10.3.44, Figure 10.3.47 and Figure 10.3.51 that the Handbook data for U, Zr and Pu metals over the solid-state transition temperature range differ from the calculated values. As discussed in Section B, the calculated thermal expansion varies linearly with temperature between the first and last solid state transitions. In the case of Zr and Pu (Figure 10.3.47 and Figure 10.3.51), this linearization has led to ignoring the thermal contractions (taking place during heatup) that occur at solid state transitions. However the behavior of the 3 metals when alloyed is different from their behavior in isolation, and the linearization is the expected behavior when alloyed.
Figure 10.3.52 to Figure 10.3.54 show the variation of linear thermal expansion with temperature for 21 alloy compositions obtained from this subroutine. The Pu and Zr contents each vary from zero to 30 wt % in the alloy compositions plotted in the figures. The solidus and liquidus temperatures required as input to the THEXP1 subroutine were calculated using another subroutine developed by Pelton [10-13]. The linear thermal expansion from 293K to solidus varies over the range 2.4% to 4.0% for the alloy compositions plotted.
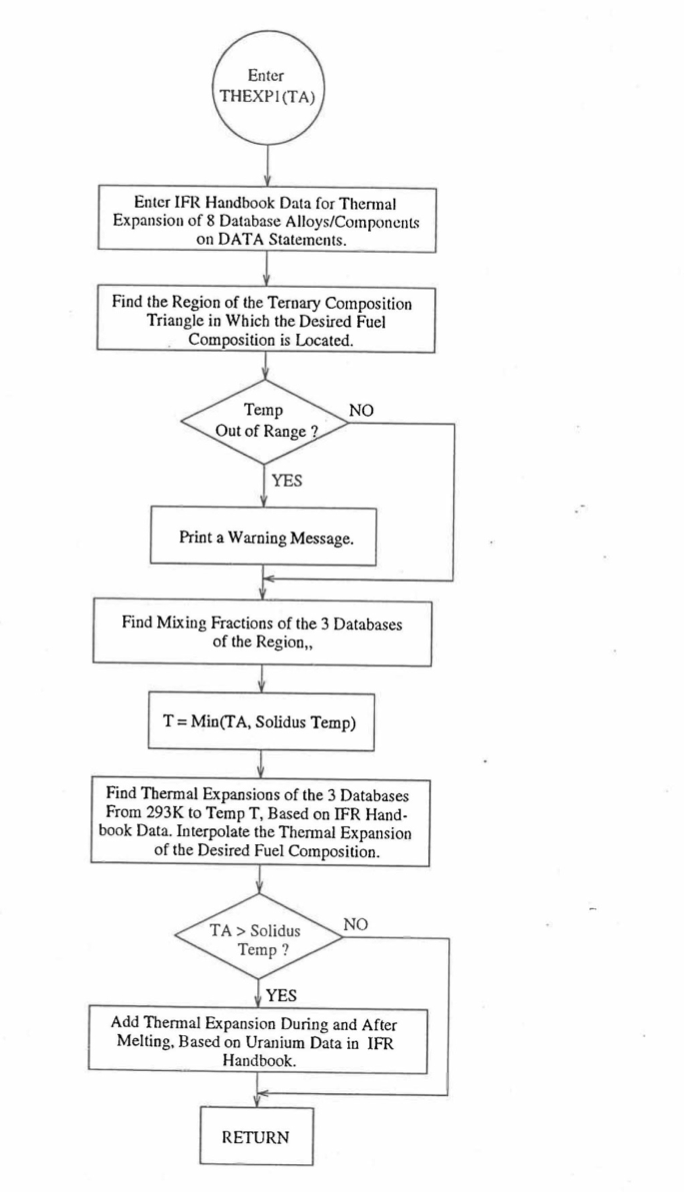
Figure 10.3.43 Flow Diagram of Subroutine THEXP2 for U-Pu-Zr Thermal Expansion.
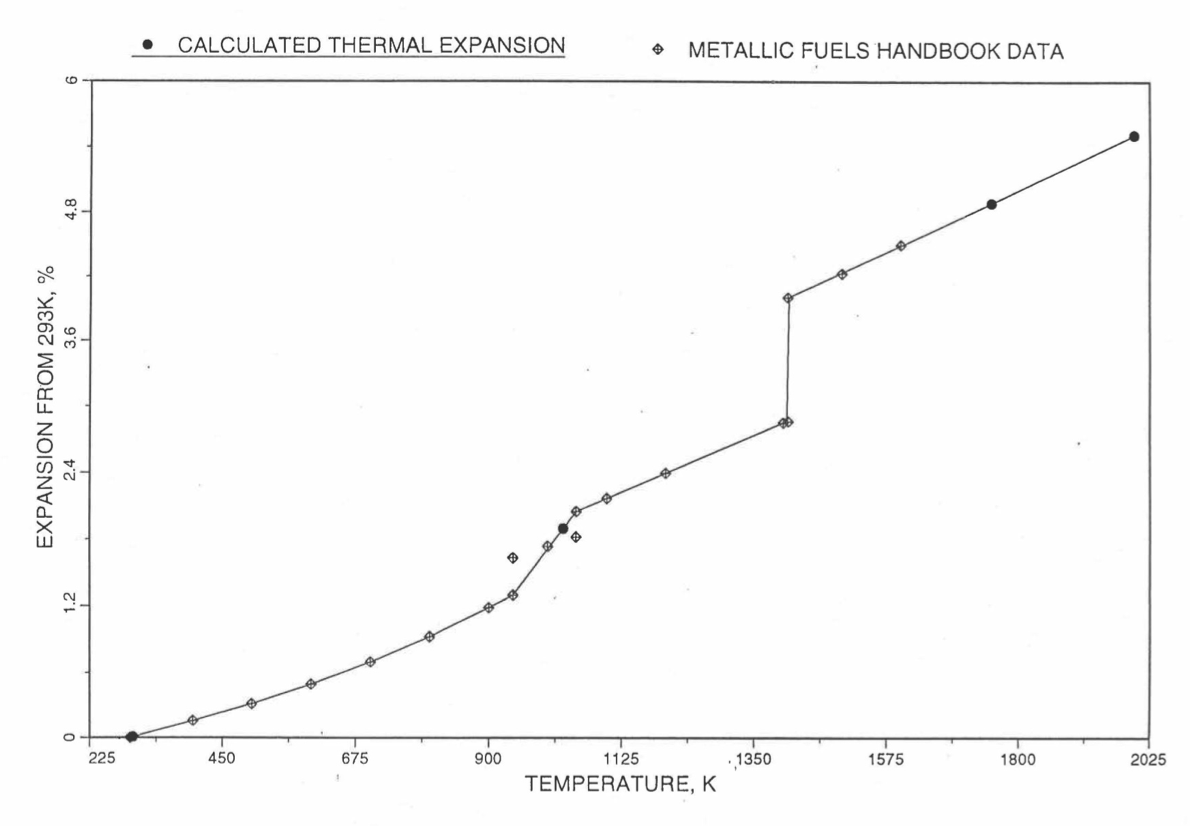
Figure 10.3.44 Comparison of Uranium Metal Linear Thermal Expansion Data in IFR Handbook With Those Calculated by the Regionwise Interpolation Subroutine THEXP1.
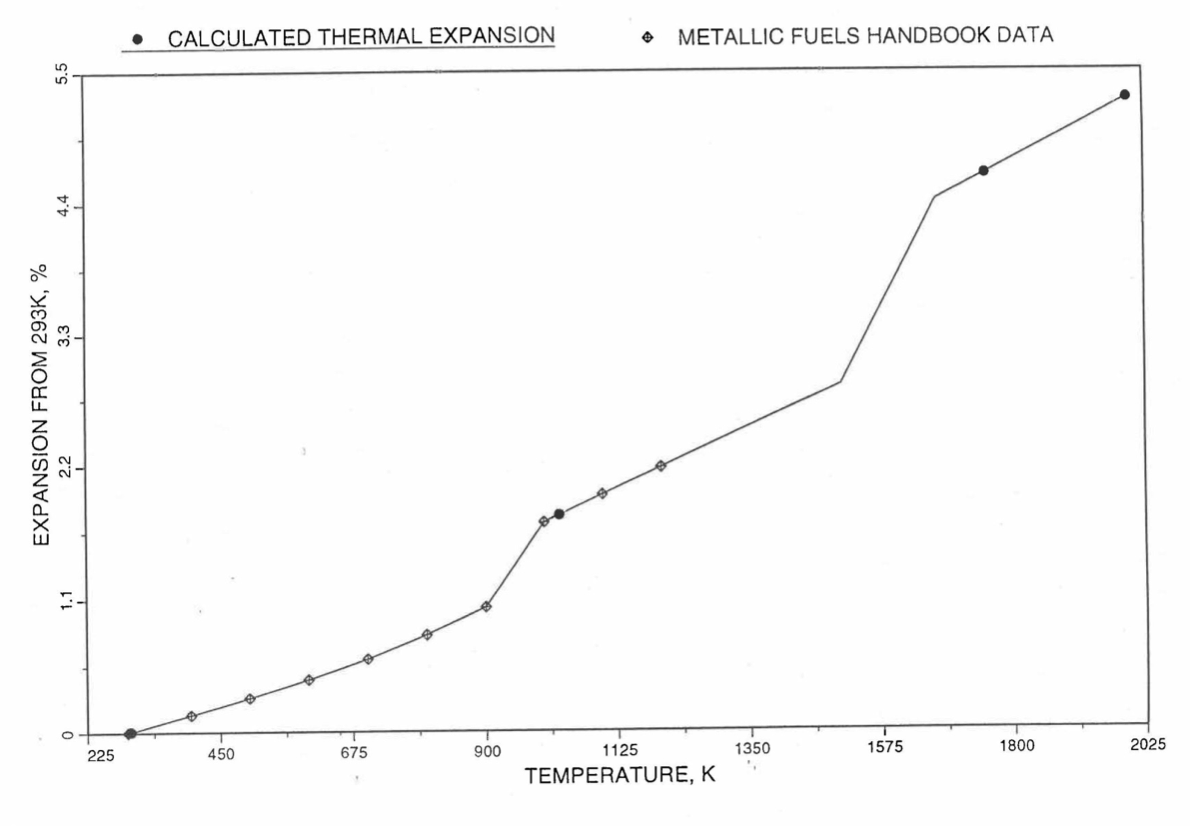
Figure 10.3.45 Comparison of U-10Zr Alloy Linear Thermal Expansion Data in IFR Handbook With Those Calculated by the Regionwise Interpolation Subroutine THEXP1.
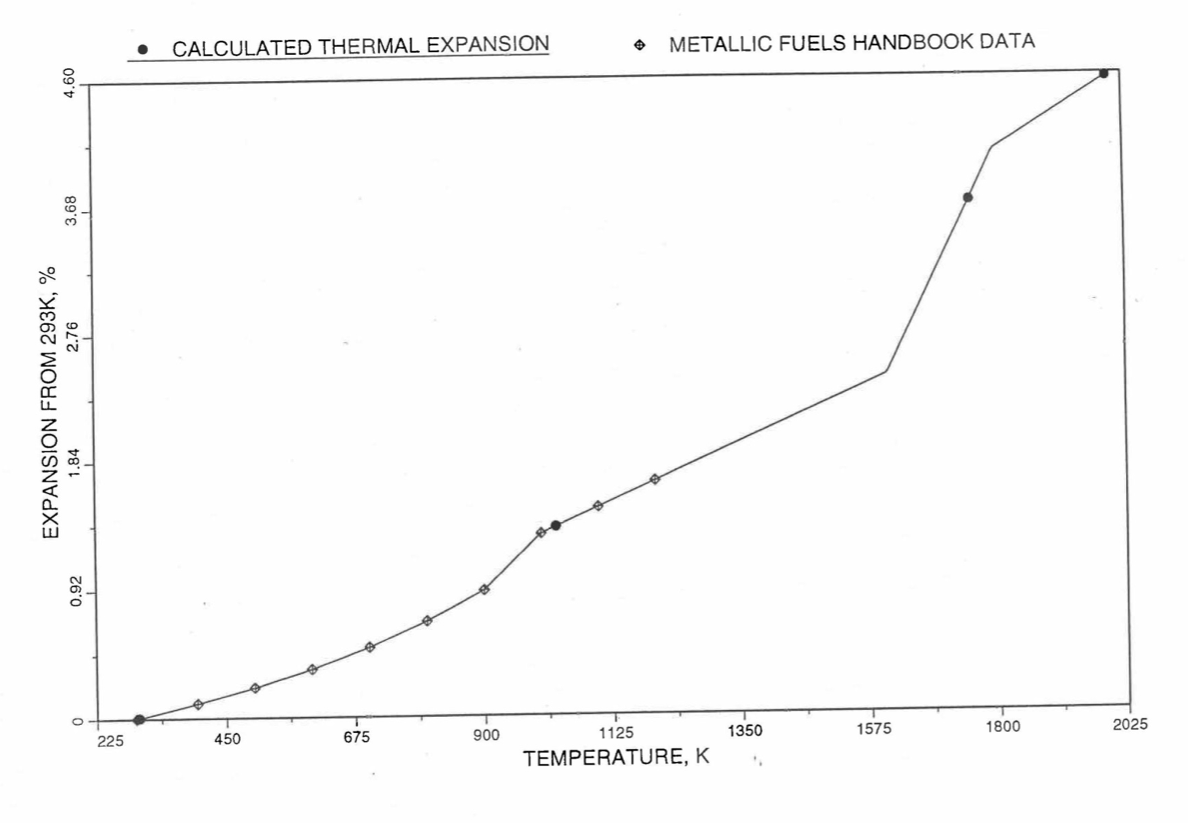
Figure 10.3.46 Comparison of U-20Zr Alloy Linear Thermal Expansion Data in IFR Handbook With those Calculated by the Regionwise Interpolation Subroutine THEXP1.
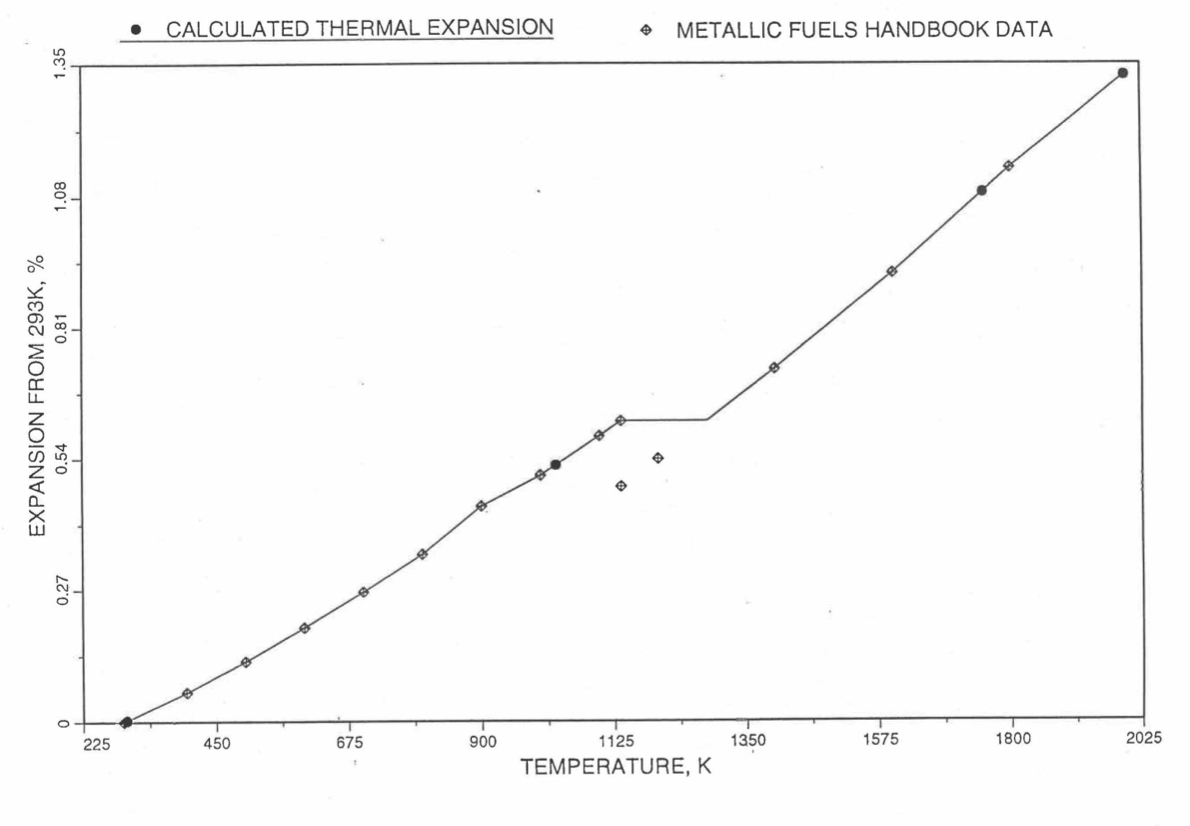
Figure 10.3.47 Comparison of Zirconium Metal Linear Thermal Expansion Data in IFR Handbook With Those Calculated by the Regionwise Interpolation Subrountine THEXP1.
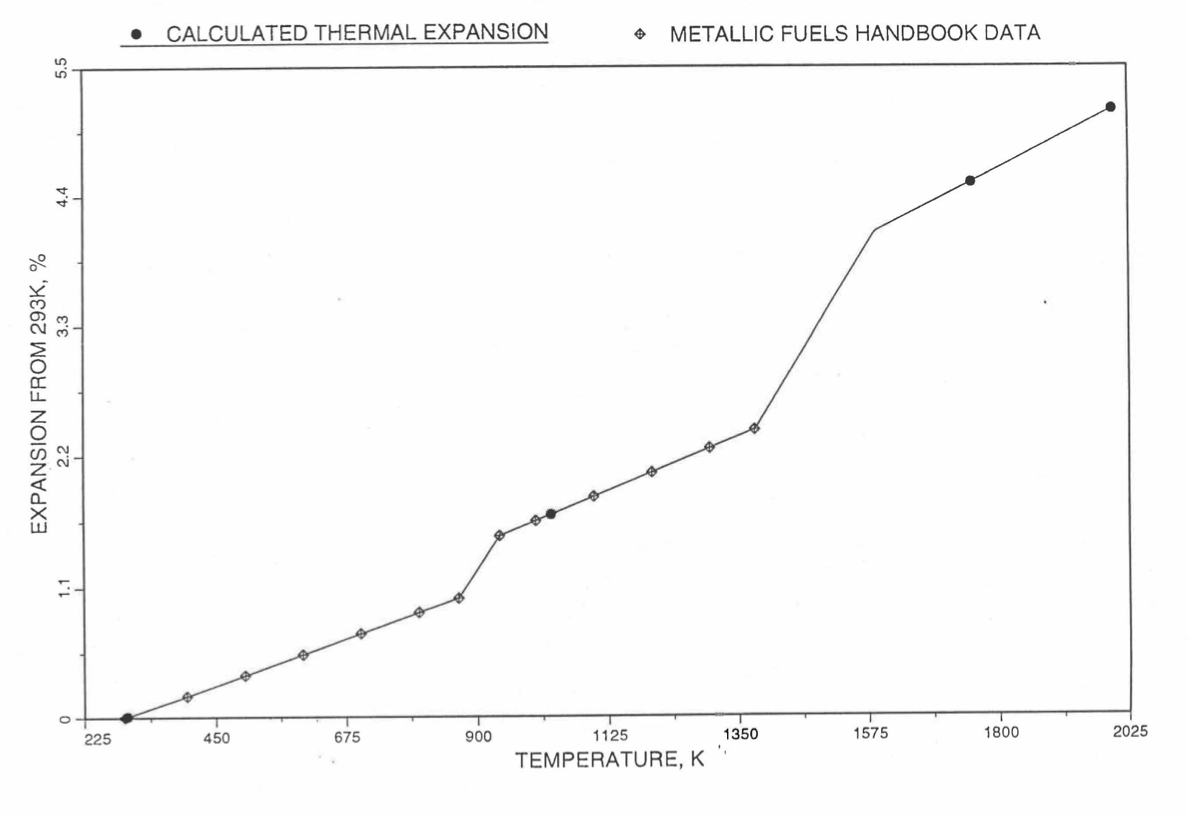
Figure 10.3.48 Comparison of U-15Pu-10Zr Linear Thermal Expansion Data in IFR Handbook With Those Calculated by the Regionwise Interpolation Subroutine THEXP1.
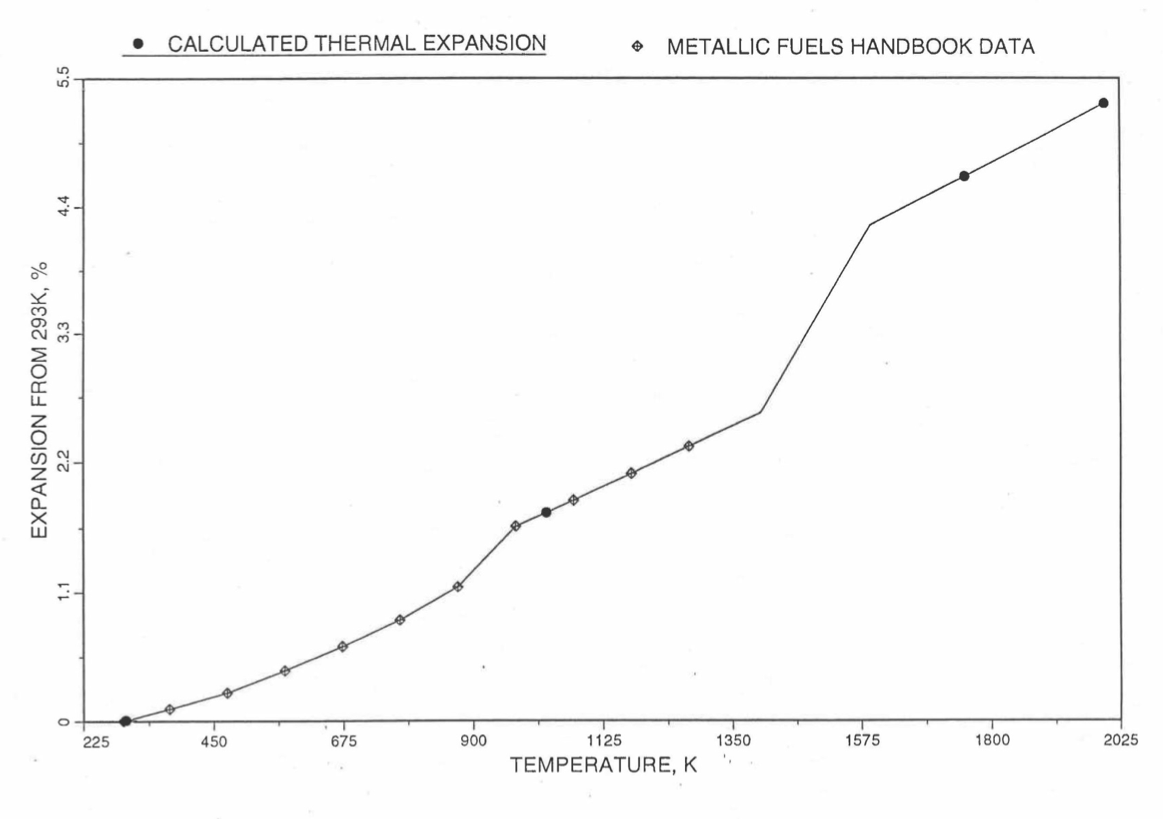
Figure 10.3.49 Comparison of U-19Pu-10Zr Linear Thermal Expansion Data in IFR Handbook With Those Calculated by the Regionwise Interpolation Subroutine THEXP1.
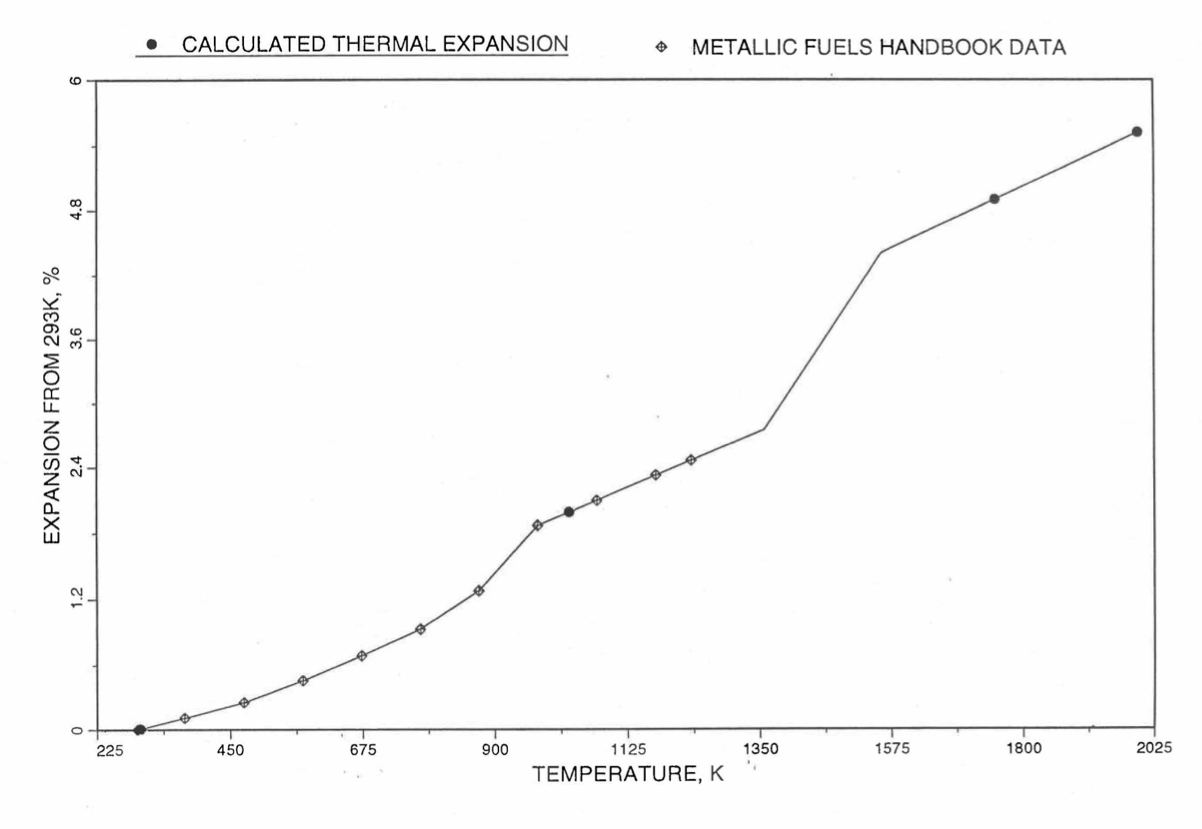
Figure 10.3.50 Comparison of U-26Pu-10Zr Linear Thermal expansion Data in IFR Handbook With those Calculated by the Regionwise Interpolation Subroutine THEXP1.
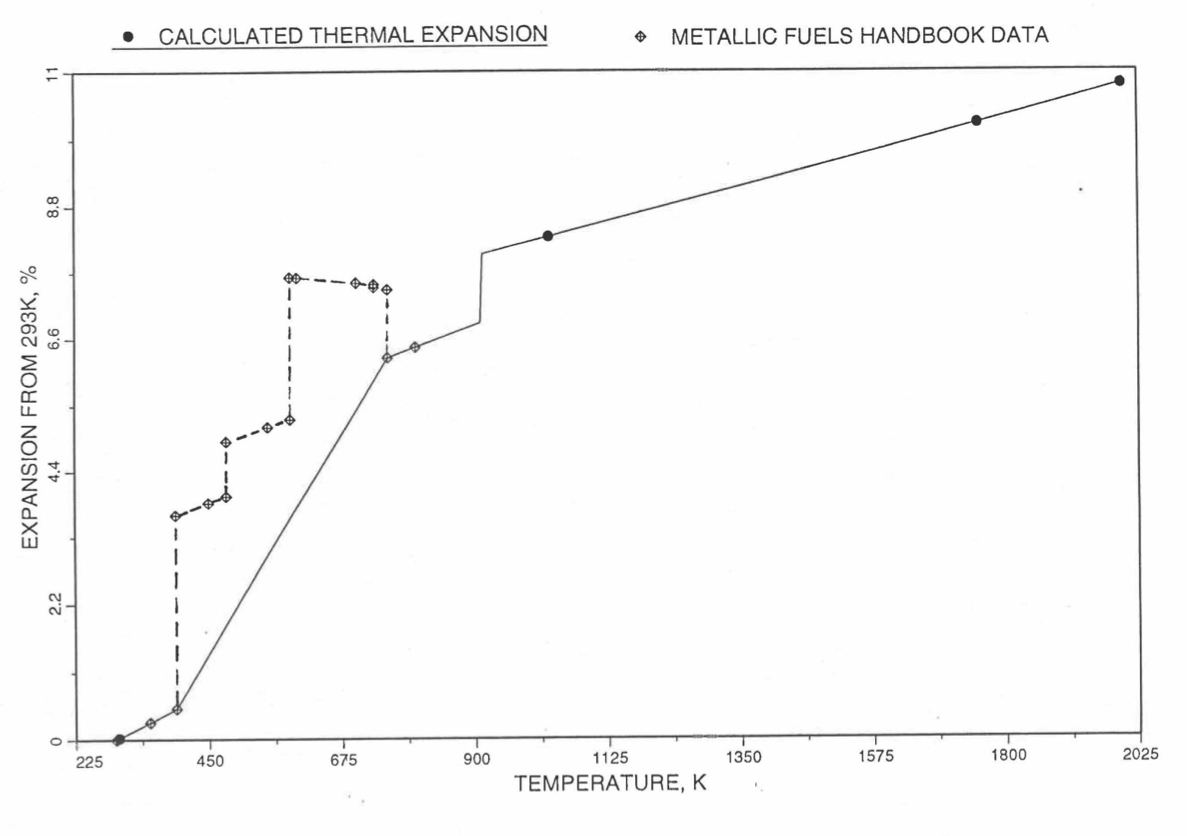
Figure 10.3.51 Comparison of Plutonium Metal Liner Thermal Expansion Data in IFR Handbook With Those calculated by the Regionwise Interpolation Subroutine THEXP1.
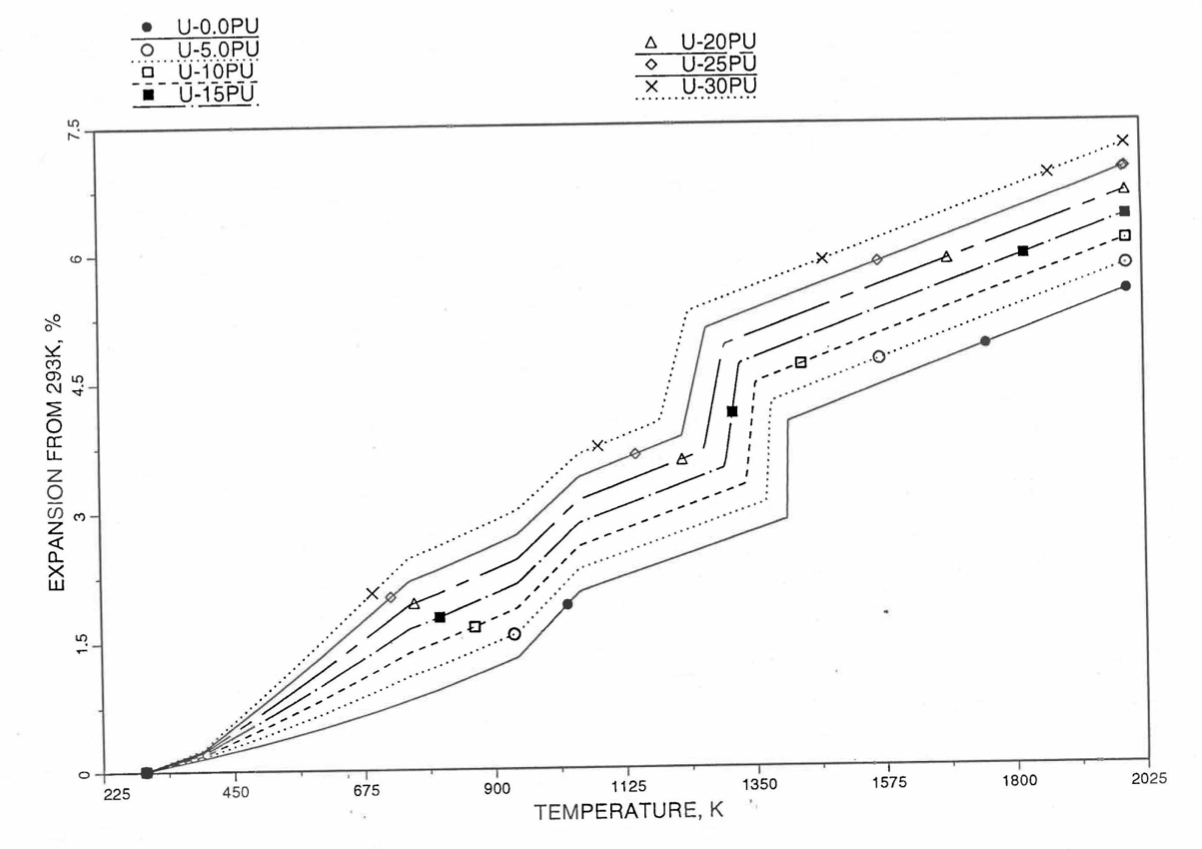
Figure 10.3.52 Linear Thermal Expansion of U-Pu Fuel Without Fission Products, Obtained From Regionwise Interpolation of IFR Handbook Data.
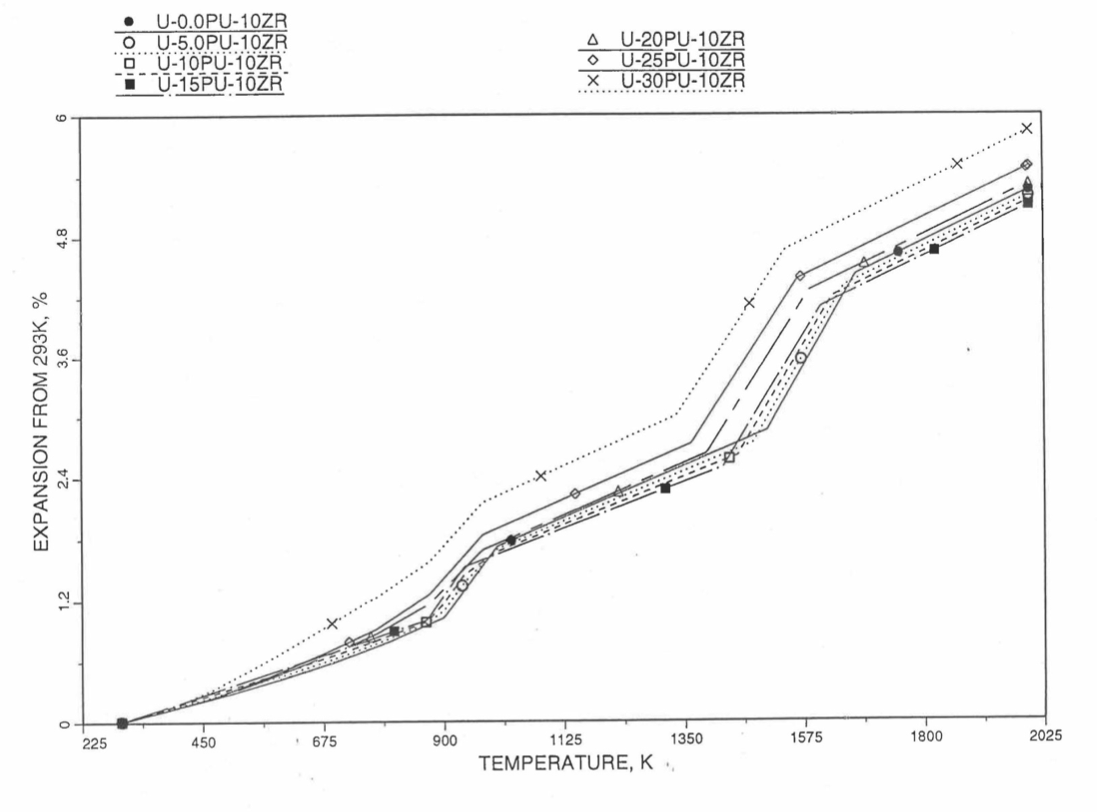
Figure 10.3.53 Linear Thermal Expansion of U-Pu-10Zr fuel Without Fission Products, Obtained From Regionwise Interpolation of IFR Handbook Data.

Figure 10.3.54 Linear Thermal Expansion of U-Pu-30Zr Fuel Without Fission Products, Obtained From Regionwise Interpolation of IFR Handbook Data.
10.3.2.5. Thermal Conductivity of Unirradiated 100% Dense U-Pu-Zr Fuel
10.3.2.5.1. Introduction
To perform calculations for the Mark-V fuel (U-20Pu-10Zr), and other metallic alloy fuels to different compositions, especially the fuel compositions across the pin radius resulting from the migration of alloy constituents during steady state irradiation, there is a need for modeling and correlation development for the thermal conductivity of U-Pu-Zr fuels as a function of composition, using the data presented in the IFR Metallic Fuels Handbook [10-8, 10-9].
Earlier, before the preparation of the Metallic Fuels Handbook [10-9], a correlation was developed to estimate the composition- and temperature-dependent thermal conductivity of 100% dense solid U-Pu-Zr alloy fuel [10-4]. In this correlation, the thermal conductivity of the U-Zr binary alloy having the uranium-to-zirconium atomic ratio of the desired U-Pu-Zr fuel was first evaluated from the data for U metal and U-50 at. % Zr alloy. This thermal conductivity was then adjusted for the presence of Pu by subtracting a term linearly proportional to Pu atom fraction where the coefficient of proportionality was determined (as a function of temperature and zirconium atom fraction) by fitting to the thermal conductivity data available for three U-Pu-Zr alloys, i.e., U-16.2Pu-6.2Zr, U-14.7Pu-9.7Zr and U-18.4Pu-11.5Zr. This correlation is valid when Pu atom fraction is less than 0.2, and Zr atom fraction is less than 0.5. The variation of thermal conductivity obtained from this correlation has been plotted for alloy compositions having 0.0 to 30 wt % Pu and 1.5 to 40 wt % Zr [10-17]. A drawback of this correlation [10-4] is that, for some alloy compositions, the thermal conductivity becomes negative (unphysical) at room temperature, and shows a maximum when plotted as a function of temperature (an unexpected behavior [10-18] for temperatures greater than 300 K). Although the allow compositions showing this unphysical/unexpected behavior are out of the noted region of validity, the correlation has another drawback that the thermal conductivity data used in obtaining the correlation were taken from sources [10-14, 10-19, 10-20] other than the Metallic Fuels Handbook.
The Metallic Fuels Handbook [10-8, 10-9] presents thermal conductivity data for U metal and a number of U-Zr and U-Pu-Zr alloys. It also gives a correlation to estimate the composition- and temperature-dependent thermal conductivity of 100% dense solid U-Pu-Zr alloys. In addition, Billone has developed, based on the data reported in the IFR Handbook [10-8], two other correlations [10-21, 10-22] for use in the analysis of EBR-II Mark-V fuel core, and so the following 3 correlations based on the Handbook data are available to estimate 100% dense solid U-Pu-Zr fuel thermal conductivity:
The correlation in the IFR Handbook [10-8, 10-9],
The correlation in Billone’s memorandum [10-21] of March 8, 1991,
The correlation in Billone’s memorandum [10-22] of October 21, 1991.
The above 3 correlations are summarized here in Section 10.7.2 for easy reference. The variation of thermal conductivity obtained form these 3 correlations have been plotted for alloy compositions having 0.0 to 30 wt % Pu and 1.5 to 40 wt % Zr [10-17]. The correlation in March 8 memorandum should not be used because it is not well-behaved, and so recommended by Billone [10-22]. The thermal conductivity obtained from this correlation, with increasing Pu content at a fixed Zr content, first increases above the U-Zr binary value, then starts decreasing and goes below the binary value, and finally starts increasing again and becomes much greater than the binary value. A drawback of the other two correlations (i.e., the correlations in the IFR Handbook and in the October 21 memorandum) is that the thermal conductivities become negative (unphysical) at room temperature for Pu and Zr contents greater than 20 wt %. Another drawback of the correlation in October 21 memorandum is that the thermal conductivity shows a maximum when plotted as a function of temperature (an unexpected behavior [10-18] for temperatures greater than 300 K). A comparison of these 3 correlations with the Handbook data for U-Zr binary alloys shows that the 3 correlations are almost identical for binary alloys [10-17], and that they agree with the data closely. The correlation in the IFR Handbook can be reliably used for binary alloys containing 1.5 to 20 wt. % Zr.
Recently, the method of estimating U-Pu-Zr alloy enthalpy by regionwise interpolation has been extended to estimate thermal conductivity of 100% dense solid U-Pu-Zr alloy fuels as a function of composition. Based on this method of calculating composition- and temperature-dependent thermal conductivity, a subroutine KFUEL1 has been developed that removes all the drawbacks mentioned above. The subroutine makes use of the thermal conductivity data of 9 basic alloys/components, compressing of all the data in the IFR Handbook [10-8, 10-9]. The U-10Pu data used in the method are obtained from Billone [10-21], and the Pu data are reported in the Plutonium Handbook [10-23]. The 9 basic alloy compositions are used to divide the ternary composition triangle into 10 regions of interpolation as shown in Figure 10.3.55. The method is flexible enough to make use of the thermal conductivity data of additional alloys (as they become available) to divide the composition triangle into a larger number of smaller regions, thus improving its accuracy. The subroutine KFUEL1 has been incorporated into the SAS4A/SASSYS‑1 codes.
The technique used at present to estimate the fuel thermal conductivity during and after melting is also discussed in this section. Since all the thermal conductivity data reported in the IFR Handbook lies in the 293 K to 1173 K temperature range, a warning message is printed by the codes whenever fuel thermal conductivity is calculated at a temperature smaller than 293 K or greater than 1200 K.

Figure 10.3.55 Diagram Showing Thermal Conductivity Interpolation Regions for 100% Dense Solid U-Pu-Zr Fuels.
10.3.2.5.2. Description of the Method
Figure 10.3.55 shows the U-Pu-Zr ternary composition triangle marked with the points representing 9 basic alloys/components comprising of all the thermal conductivity data reported in the IFR Handbook [10-8, 10-9]. The U-10Pu data used here are obtained from Billone [10-21], and the Pu data are reported in the Plutonium Handbook [10-23], and a warning message is printed by the codes when these two data are actually used in any calculation. The composition points of these 9 database alloys/components are used to divide the whole ternary composition triangle into 10 triangular regions of interpolation as shown in Figure 10.3.55. For evaluating the thermal conductivity of a desired solid U-Pu-Zr alloy represented by a point located in any region of interpolation, the method consists of mixing the 3 database alloys represented by the corners of the region of interpolation. The proportions or weight fractions of the 3 database alloys in mixing are so calculated in the method that the resulting mixture has the composition of the desired alloy. The calculated mixing fractions are then used as weight factors in making a linear combination of (or linear interpolation between) thermal conductivity data of the 3 database alloys, and the linear combination gives the interpolated thermal conductivity of the desired alloy. The thermal conductivity data of each basic alloy/component are least-square fitted by aquadratic function of temperature.
(10.3‑52)
where
\(K_{\text{0i}}\) = thermal conductivity of the ith 100%-dense solid database alloy/component, W/m-K,
\(A_{\text{i1}}, A_{\text{i2}}, A_{\text{i3}}\) = coefficients of the quadratic for the thermal conductivity of the ith database alloy,
\(T\) = alloy temperature, K.
The interpolation of the thermal conductivity data of the 3 basic alloys is performed by interpolating between the coefficients (of like terms) of the quadratics for the 3 basic alloys. The calculated mixing fractions are never negative and the linear combination never requires extrapolation because the desired alloy composition point is always inside the triangle with corners at the 3 database alloy points. If the desired alloy composition point were outside this triangle, the linear combination would involve negative mixing fractions and extrapolation which are avoided entirely in the present method.
A different method of interpolation is used in region 3 (Figure 10.3.55) in order to employ the Handbook U-Zr binary correlation for composition points on the side joining corners 2 and 3, i.e., for binary compositions containing 1.5 to 20 wt % Zr. This is done because the Handbook binary correlation (Eq. A10.2-1) with Pu content set to zero) is accurate for Zr content in this range, as discussed in Section 10.7.1. The thermal conductivity of a desired U-Pu-Zr alloy in region 3 (represented by point F in Figure 10.3.55) is interpolated between only two compositions, the database alloy 5 and binary alloy represented by point A. The point A is the intersection of the side 23 with the line F5 that joins the desired alloy and the database alloy 5. Here also, the interpolation between the database alloy 5 and the binary correlation is performed in terms of the coefficients (of like terms) of the quadratics for thermal conductivity.
10.3.2.5.3. Thermal Conductivity Data of Basic Alloys
Table 10.3.4 gives the thermal conductivity data of the 9 basic solid alloys or components that are used in the present method of evaluating composition- and temperature- dependent thermal conductivity of 100% dense solid U-Pu-Zr fuels. Table 10.3.5 gives the coefficient of the quadratic functions of temperature fitted to the data given in Table 10.3.4. The 9 basic alloys/components are: (1) U metal, (2) U-1.5Zr, (3) U-20Zr, (4) U-40Zr, (5) U-14.7Pu-9.7Zr, (6) U-18.4Pu-11.5Zr, (7) U-10Pu, (8) Pu metal, and (9) U-16.2Pu-6.2Zr. The coefficients of the quadratics for all database alloys except U-1.5 Zr and U-20 Zr are obtained by the method of least-squares fit. The coefficients of the quadratics for U-1.5 Zr an U-20 Zr are evaluated form the Handbook binary correlation. This is required to make the thermal conductivity continuous at the boundary lines of interpolation region 3 (Figure 10.3.55). All the data available in the Metallic Fuels Handbook [10-8, 10-9] have been included in the database used in the present method. Data for two non-Handbook alloys/components, i.e., U-10 Pu data obtained from Billone [10-21] and Pu data reported in the Plutonium handbook [10-23], have also been included in the database of the present method. The U-Pu data is the only intermediate point on the U-Pu binary side of the ternary composition triangle (Figure 10.3.55), and has been included to account for thermal conductivity variation of U-Pu binary as Pu content increases from zero to 100 wt. %. The Pu data has been included to be able to interpolate Mark-V fuel (U-10Pu-10Zr) thermal conductivity because all the other database alloys/components contain les than 20 wt. % Pu. Without the Pu data, the evaluation of thermal conductivity of fuels containing more than 18.4 wt. % Pu will involve extrapolation, which is avoided in the present method.
The quadratic functions given in Table 10.3.5 are used in the temperature range of 293 K to the solidus temperature of the desired U-Pu-Zr alloy. Since the thermal conductivity data of the 9 basic alloys/components (Table 10.3.4) used in the present method go only up to 1173 K, a warning message is printed by the code when the method is used to calculate thermal conductivity at temperatures above 1200 K. A similar warning message is also printed when the method is used at temperatures below 293 K. The thermal conductivity at temperatures above the desired alloys solidus temperature is assumed to be equal to the value at the solidus temperature as discussed in Section E.
|
|
|
|
|
|
|
|
|
|||||||||
|---|---|---|---|---|---|---|---|---|---|---|---|---|---|---|---|---|---|
Temp, K |
Cond, W/m-K |
Temp, K |
Cond, W/m-K |
Temp, K |
Cond, W/m-K |
Temp, K |
Cond, W/m-K |
Temp, K |
Cond, W/m-K |
Temp, K |
Cond, W/m-K |
Temp, K |
Cond, W/m-K |
Temp, K |
Cond, W/m-K |
Temp, K |
Cond, W/m-K |
293 |
27 |
293 |
22.6 |
293 |
11 |
293 |
7 |
373 |
10 |
373 |
9.2 |
473 |
23.9 |
293 |
\(4.1 \pm 6.1 \%\) |
373 |
10.9 |
373 |
29.1 |
373 |
24 |
373 |
13 |
373 |
8 |
473 |
13.2 |
473 |
11.7 |
673 |
28.9 |
400 |
\(10.2 \pm 9.2 \%\) |
473 |
14.2 |
473 |
31.1 |
473 |
26 |
473 |
15 |
473 |
10 |
573 |
16.4 |
573 |
14.4 |
873 |
36.4 |
500 |
\(12.3 \pm 6.5 \%\) |
573 |
17.7 |
573 |
33.4 |
573 |
38.5 |
573 |
17 |
573 |
12 |
673 |
19.6 |
673 |
17.1 |
1073 |
41.9 |
600 |
\(15.8 \pm 5.4 \%\) |
673 |
21 |
673 |
35.8 |
673 |
31 |
673 |
20 |
673 |
14 |
773 |
22.5 |
773 |
19.7 |
700 |
\(18.2 \pm 4.4 \%\) |
773 |
24.1 |
||
773 |
38.2 |
773 |
34 |
773 |
22 |
773 |
17 |
873 |
25.3 |
873 |
21.9 |
800 |
\(18.2 \pm 2.5 \%\) |
873 |
26.4 |
||
873 |
40.6 |
873 |
37 |
873 |
25 |
873 |
20 |
973 |
27.8 |
973 |
23.4 |
900 |
\(20.8 \pm 2.5 \%\) |
973 |
28 |
||
973 |
43.2 |
973 |
40.5 |
973 |
28 |
973 |
24 |
1073 |
30.1 |
1073 |
24.8 |
2000a |
47.1 |
1073 |
29.3 |
||
1073 |
45.7 |
1073 |
44.5 |
1073 |
31 |
1073 |
28 |
1173 |
32.3 |
1173 |
26 |
1173 |
30.1 |
||||
1173 |
48.3 |
1173 |
34 |
1173 |
33 |
Coefficients of Quadratica |
||||||
|---|---|---|---|---|---|---|
No. |
Database Alloy/Component |
\(A_{\text{i}1}\) |
\(A_{\text{i}2}\) |
\(A_{\text{i}3}\) |
RMSb Error, % |
Maximum Error, % |
1 |
Uranium |
20.931 |
0.020407 |
\(2.4968 \times 10^{-6}\) |
0.30 |
0.72 |
2 |
U-1.5Zr,c |
16.516 |
0.015051 |
\(9.3800 \times 10^{-6}\) |
1.94 |
3.85 |
3 |
U-20Zr,c |
7.336 |
0.011791 |
\(9.3800 \times 10^{-6}\) |
2.07 |
5.40 |
4 |
U-40Zr |
6.0734 |
-0.0025711 |
\(2.1589 \times 10^{-5}\) |
1.78 |
3.13 |
5 |
U-14.7Pu-9.7Zr |
-4.3462 |
0.041352 |
\(-8.5931 \times 10^{-6}\) |
0.58 |
1.18 |
6 |
U-18.4Pu011.5Zr |
-4.3270 |
0.040293 |
\(-1.2208 \times 10^{-5}\) |
1.71 |
2.57 |
7 |
U-10Pu |
10.716 |
0.025919 |
\(3.1250 \times 10^{-6}\) |
1.83 |
2.34 |
8 |
Plutonium |
-4.6825 |
0.033747 |
\(-3.9751 \times 10^{-6}\) |
14.6 |
19.9 |
9 |
U-16.2Pu-6.2Zr |
-7.6844 |
0.057035 |
\(-2.1028 \times 10^{-5}\) |
1.69 |
2.74 |
aThermal conductivity \(K_{\text{oi}} = A_{\text{i}1} + A_{\text{i}2} T + A_{\text{i}3} T_{2}\) where \(i\) is database alloy number.
bRMS Error is root mean square error or the standard deviation.
cThe coefficients of the quadratic function for these two database alloys are obtained from Handbook binary correlation whereas the coefficients for all the other database alloys are found by least-squares fit.
10.3.2.5.4. Method of Interpolation
The method of interpolation to evaluate the thermal conductivity of a 100%-dense U-Pu-Zr fuel composition at and below its solidus temperature consists of first determining the region of the ternary composition triangle (shown in Figure 10.3.55) in which the desired fuel composition lies, and then finding the weight fractions in which the 3 database alloys of the region are required to be mixed to obtain the desired fuel composition. From the mass balance of U, Pu and Zr, the following equations have been obtained in Section 10.3.2.1 for the weight fractions, \(X_{\text{i}}\), of the database alloys that are assumed to be numbered 1, 2 and 3.
(10.3‑53)
(10.3‑54)
(10.3‑55)
(10.3‑56)
(10.3‑57)
where
\(W_{\text{ui}}, W_{\text{pi}}, W_{\text{zi}}\) = weight fractions of U, Pu and Zr in database alloy I of the region in which the desired fuel composition lies,
\(W_{\text{u}}, W_{\text{p}}, W_{\text{z}}\) = weight fractions of U, Pu and Zr in the desired fuel composition.
The sum of \(X_{1}, X_{2}\) and \(X_{3}\) is always 1. In case of interpolation, the values of \(X_{1}, X_{2}\) and \(X_{3}\) are always positive. If any extrapolation were involved, the value of a least one weight fraction would be negative which is entirely avoided in the present method. The coefficients of the Quadratic for the thermal conductivity of the desired 100%-dense U-Pu-Zr fuel composition are then evaluated by mass-weighted averaging of the coefficients (of like terms) of the quadratics for the thermal conductivities of the 3 database alloys.
(10.3‑58)
(10.3‑59)
(10.3‑60)
here
\(A_{\text{f}1}, A_{\text{f}2}, A_{\text{f}3}\) = coefficients of the quadratic for thermal conductivity of the desired fuel composition,
\(A_{\text{i}1}, A_{\text{i}2}, A_{\text{i}3}\) = coefficients of the quadratic for thermal conductivity of the ith database alloy/component.
The thermal conductivity of the desired 100%-dense U-Pu-Zr fuel composition at a temperature T at or below its solidus is then calculated using its quadratic.
(10.3‑61)
where
\(K_{0} \left( T \right)\) = thermal conductivity of the desired 100%-dense U-Pu-Zr fuel composition.
It should be noted that the method of interpolation given by Eqs. (10.3-58) to (10.3-61), in which first the coefficients of the quadratic for the desired alloy are calculated and then the thermal conductivity, is equivalent to interpolating the desired alloy thermal conductivity directly from the thermal conductivities of the database alloys.
(10.3‑62)
where
\(K_{0\text{i}} \left( T \right)\) = thermal conductivity of 100%-dense solid database alloy I of the region in which the desired fuel composition lies.
As described in Section B, the thermal conductivity of a desired U-Pu-Zr fuel composition in region 3, represented by point F (Figure 10.3.55), is interpolated between only tow compositions, the database alloy 5 and the U-Zr binary alloy represented by point A. The point A is the interaction of the side 23 (of region 3) with the line F5 that joins the desired alloy and the database alloy 5. The Zr content of the binary alloy A is given by
(10.3‑63)
where
\(W_{\text{za}}\) = weight fraction of Zr in the binary alloy A,
\(W_{\text{p}5}, W_{\text{z}5}\) = weight fractions of Pu and Zr in the database alloy 5,
\(W_{\text{p}}, W_{\text{z}}\) = weight fractions of Pu and Zr in the desired fuel composition.
The coefficients of the quadratic for thermal conductivity of the U-Zr alloy A are found from the IFR Handbook binary correlation [10-8, 10-9], by setting the Pu weight fraction to zero and the Zr weight fraction to \(W_{\text{za}}\) in Eq. (A10.2-1).
(10.3‑64)
(10.3‑65)
(10.3‑66)
where
\(A_{\text{a}1}, A_{\text{a}2}, A_{\text{a}3}\) = coefficients of the quadratic for thermal conductivity of binary alloy A.
The coefficients of the quadratic for thermal conductivity of the desired fuel composition in region 3 are then interpolated between the coefficients of the quadratic for binary alloy A and those for database alloy 5.
(10.3‑67)
where
\(A_{\text{f}1}, A_{\text{f}2}, A_{\text{f}3}\) = coefficient of the quadratic for thermal conductivity of the desired fuel represented by point F in region 3.
10.3.2.5.5. Thermal Conductivity During and After Melting
The quadratic functions of temperature, given in Table 10.3.5, are used to interpolate thermal conductivity of a desired U-Pu-Zr alloy in the temperature range of 293 K to the solidus temperature of the desired alloy. The thermal conductivity at temperatures above the desired alloy solidus temperature is assumed to be equal to the value at the solidus temperature because of two reasons: (1) U-Pu-Zr alloy thermal conductivity data during and after melting are not available, and (2) molten uranium thermal conductivity estimated form its electrical resistivity [10-24] using Wiedermann-Lorenz law, as described below, is nearly equal to solid uranium thermal conductivity evaluated at its melting point using the quadratic function given in Table 10.3.5.
Wiedermann-Lorenz law [10-25] gives the following relation between thermal conductivity and electrical resistivity of metals and alloys at temperatures above 150 K.
(10.3‑68)
where
\(K_{\text{o}}\) = thermal conductivity of 100% dense metal or alloy, W/m-K,
\(\rho\) = electrical resistivity of the material, \(\Omega\)-m,
\(L\) = a constant called Lorenz number determined from theoretical considerations to be \(2.45 \times 10^{-4}\) W-\(\Omega\)/K2 for all metals.
Table 10.3.6 gives the electrical resistivity data [10-24] for uranium at temperatures from 293 K to 1573 K. The thermal conductivities at lower (than melting) temperatures, i.e., 293 K, 873 K, 973 K and 1073 K, are also included in Table 10.3.6 to examine the difference between the experimentally determined Lorenz numbers and the theoretical value of \(2.45 \times 10^{-8}\) W-\(\Omega\)/K2. The Lorentz numbers determined from data at these four lower (than melting) temperatures are approximately equal to the theoretical value. The thermal conductivities of uranium at and above the melting temperature have been calculated using the theoretical value of the Lorenz number, and found to be 54.2, 55.3 and 56.8 W/m-K at 1406 K, 1473 K and 1573 K. These thermal conductivity estimates are nearly equal to the value of 54.6 W/m-K calculated for solid uranium at its melting point (of 1408 K that is used in SAS4A/SASSYS‑1 codes) using the quadratic function given in Table 10.3.5. From this comparison, it is concluded that there is no discontinuity in uranium thermal conductivity at its melting point. It should be noted from plots [10-18] of thermal conductivity as a function of temperature that several other metals do show a sharp discontinuity at the melting point.
At present, the thermal conductivity of all alloy compositions at temperatures above the solidus are assumed to remain constant and equal to the value at the solidus, and a warning message is printed by the code whenever this assumption is used.
10.3.2.5.6. Subroutine KFUEL1 and Its Comparison With the Handbook Data
Figure 10.3.56 shows flow diagram of the subroutine KFUEL1 for calculating the thermal conductivity, based on this method of regionwise interpolation, of a 100% dense U-Pu-Zr fuel as a function of composition and temperature. This subroutine has been incorporated into the SAS4A/SAASSYS-1 codes. For improving the computational speed, the coefficients of the quadratic for thermal conductivity of 100% dense U-Pu-Zr alloy of each input fuel type is pre-calculated before steady-state calculation, and used later in the steady-state and transient calculations of the codes.
Temperature, K |
Electrical Resistivity, Ω-m |
Thermal Conductivity,a W/m-K |
Computed Value of L, W-Ω/K2 |
|---|---|---|---|
293 |
\(30.0 \times 10^{-8}\) |
27.0 |
\(2.76 \times 10^{-8}\) |
873 |
\(59.0 \times 10^{-8}\) |
40.6 |
\(2.74 \times 10^{-8}\) |
973 |
\(55.5 \times 10^{-8}\) |
43.2 |
\(2.46 \times 10^{-8}\) |
1073 |
\(54.0 \times 10^{-8}\) |
45.7 |
\(2.30 \times 10^{-8}\) |
1406b |
\(63.6 \times 10^{-8}\) |
54.2 |
\(2.45 \times 10^{-8}\) |
1473 |
\(65.3 \times 10^{-8}\) |
55.3 |
\(2.45 \times 10^{-8}\) |
1573 |
\(67.8 \times 10^{-8}\) |
56.8 |
\(2.45 \times 10^{-8}\) |
aThe first four values are obtained from IFR Handbook data summarized in Table 10.3.4, and the next three values at 1406 K, 1473 K and 1573 K, are calculated using Wiedermann-Lorenz Law with constant \(L = 2.45 \times 10^{-8}\) W-\(\Omega\)/K2.
bUranium melting point reported in Ref. [10-24] compared to 1408 K given in the IFR Handbook and used in SAS4A/SASSYS‑1 codes. The value 1406 K is used only in this table for estimating molten uranium thermal conductivity.
Figure 10.3.57 to Figure 10.3.67 show the comparison of calculated thermal conductivity with all the data in the Metallic Fuels Handbook [10-8] and with the data for U-10Pu alloy [10-21] and Pu metal [10-23] given in Table 10.3.4. There is a close agreement between the calculated and the measured thermal conductivities of all these alloys except U-11.4 Zr and Pu metal. In the case of u-11.4 Zr, there are two outlying data points, one at 673 K and the other at 1173 K, and the rest of the data points are in fair agreement with the calculated curve (Figure 10.3.60). It should be noted that the calculated curve for this alloy basically arises from the Handbook binary correlation [10-8], which is accurate for both the neighboring binary alloys (i.e., U-5Zr and U20Zr plotted in Figure 10.3.59 and Figure 10.3.61) for which data are available. Based on the degree of confidence in the Handbook binary correlation, the two outlying data points at 673 K and 1173 K are not believed to be reliable enough to require a revision of the subroutine KFUEL1. In the case of Pu metal, the scatter of the data points about the calculated curve is caused by a number of solid-state phase transitions. However, the behavior of Pu when alloyed with U and Zr is different from its behavior in isolation, and the smooth quadratic function of temperature use in calculation (in the subroutine KFUEL1) is closer to the expected behavior when alloyed.
Figure 10.3.68 to Figure 10.3.70 show the variation of thermal conductivity with temperature for 20 100%-dense alloy compositions obtained from this subroutine. The Pu content varies from zero to 30 wt. % and the Zr content varies from 1.0 to 30 wt. % in the alloy compositions plotted in the figures. The solidus and liquidus temperatures required as input to the KFUEL1 subroutine were calculated using another subroutine developed by Pelton [10-13]. It should be noted that each thermal conductivity curve is flat at temperatures above the solidus temperature of the alloy. The thermal conductivities do not show any unphysical or unexpected behavior.

Figure 10.3.56 Flow Diagram of Subroutine KFUEL1 for 100% Dense U-Pu-Zr Thermal Conductivity.

Figure 10.3.57 Comparison of 100% Dense Uranium Metal Thermal Conductivity Data in IFR Handbook With Those Calculated by Subroutine KFUEL1.

Figure 10.3.58 Comparison of 100% Dense U-1.5Zr Fuel thermal Conductivity Data in IFR Handbook With Those Calculated by Subroutine KFUEL1.
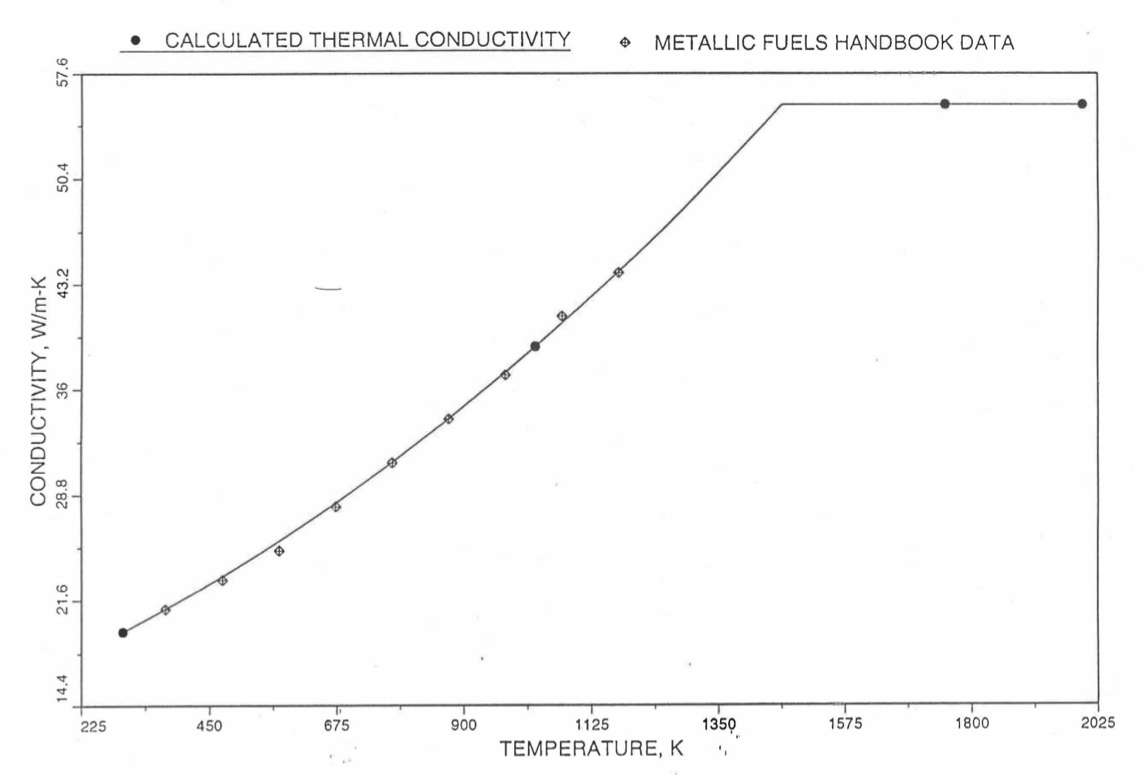
Figure 10.3.59 Comparison of 100% Dense U-5.9Zr Fuel Thermal Conductivity Data in IFR Handbook With Those Calculated by Subroutine KFUEL1.
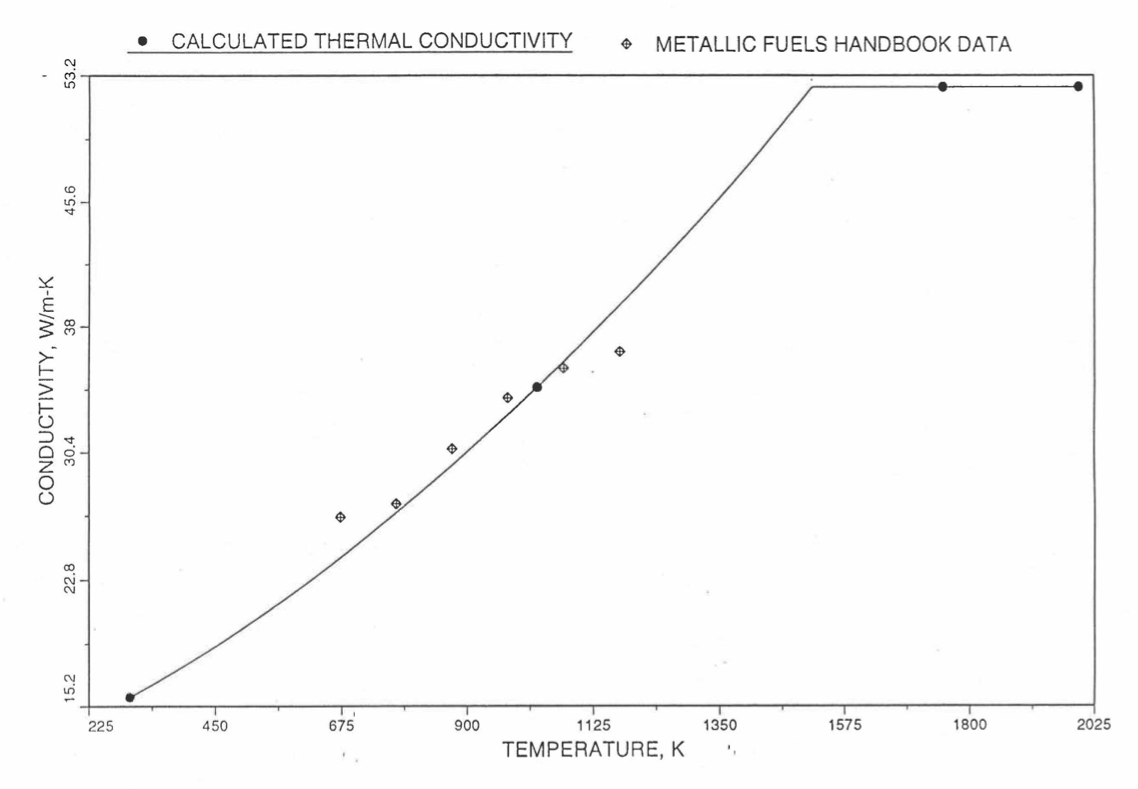
Figure 10.3.60 Comparison of 100% Desense U-11.4Zr Fuel Thermal Conductivity Data in IFR Handbook With Those Calculated by Subroutine KFUEL1.
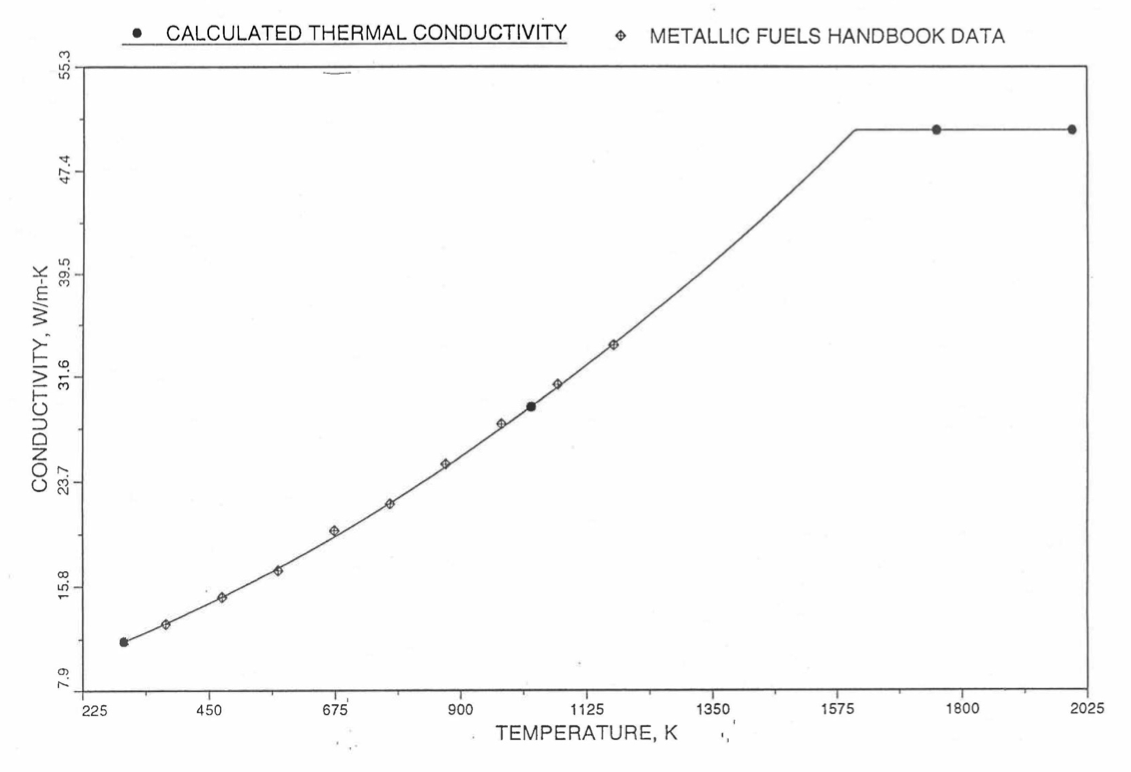
Figure 10.3.61 Comparison of 100% Dense U-20Zr Fuel Thermal Conductivity Data in IFR Handbook With Those Calculated by Subroutine KFUEL1.
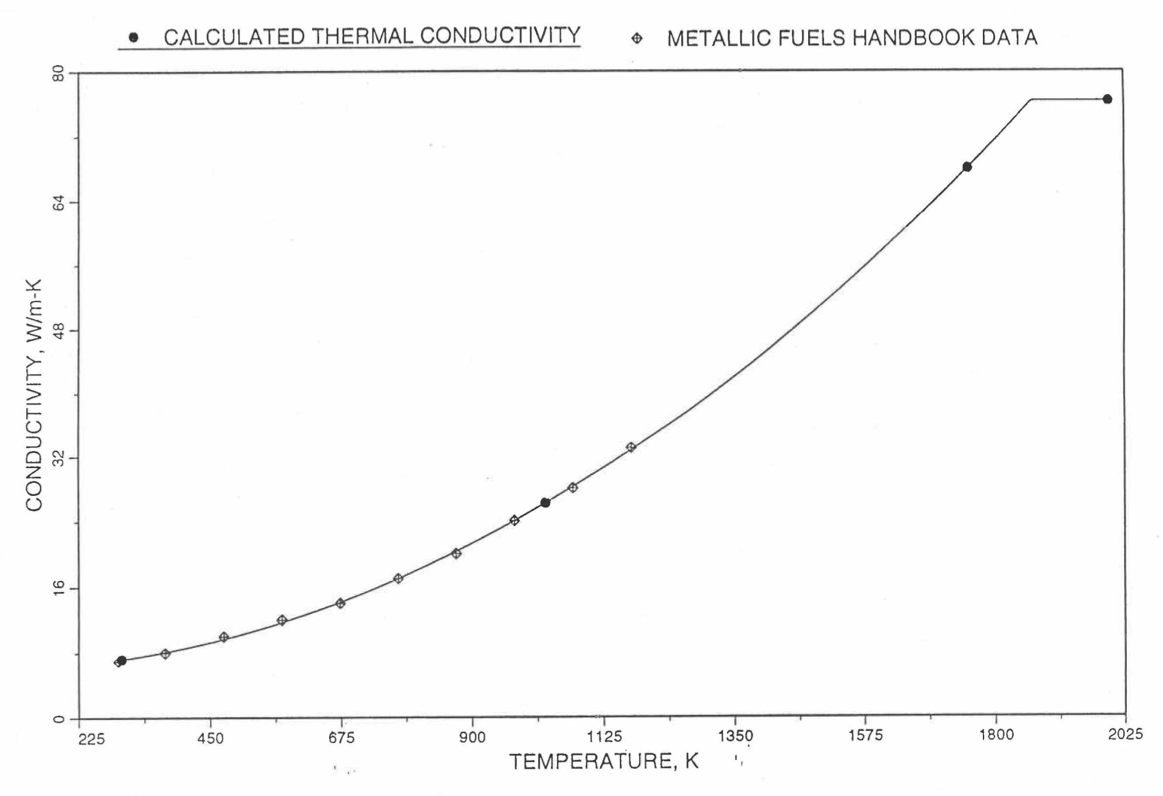
Figure 10.3.62 Comparison of 100% Dense U-40Zr Fuel Thermal Conductivity Data in IFR Handbook With Those Calculated by Subroutine KFUEL1.

Figure 10.3.63 Comparison of 100% Dense U-14.7Pu-9.7Zr Fuel Thermal Conductivity Data in IFR Handbook With Those Calculated by Subroutine KFUEL1.

Figure 10.3.64 Comparison of 100% Dense U-18.4Pu-11.5Zr Fuel Thermal Conductivity Data in IFR Handbook With Those Calculated by Subroutine KFUEL1.

Figure 10.3.65 Comparison of 100% Dense U-16.2Pu-6.2Zr Fuel Thermal Conductivity Data in IFR Handbook With Those Calculated by Subroutine KFUEL1.

Figure 10.3.66 Comparison of 100% Dense U-10Pu Fuel Thermal Conductivity Data With Those Calculated by Subroutine KFUEL1.

Figure 10.3.67 Comparison of 100% Dense Pu Metal Thermal Conductivity Data in Plutonium Handbook With Those Calculated by Subroutine KFUEL1.

Figure 10.3.68 Thermal Conductivity of 100% Dense U-Pu-1.0Zr Alloy Fuel, Obtained From Regionwise Interpolation of IFR Handbook Data.
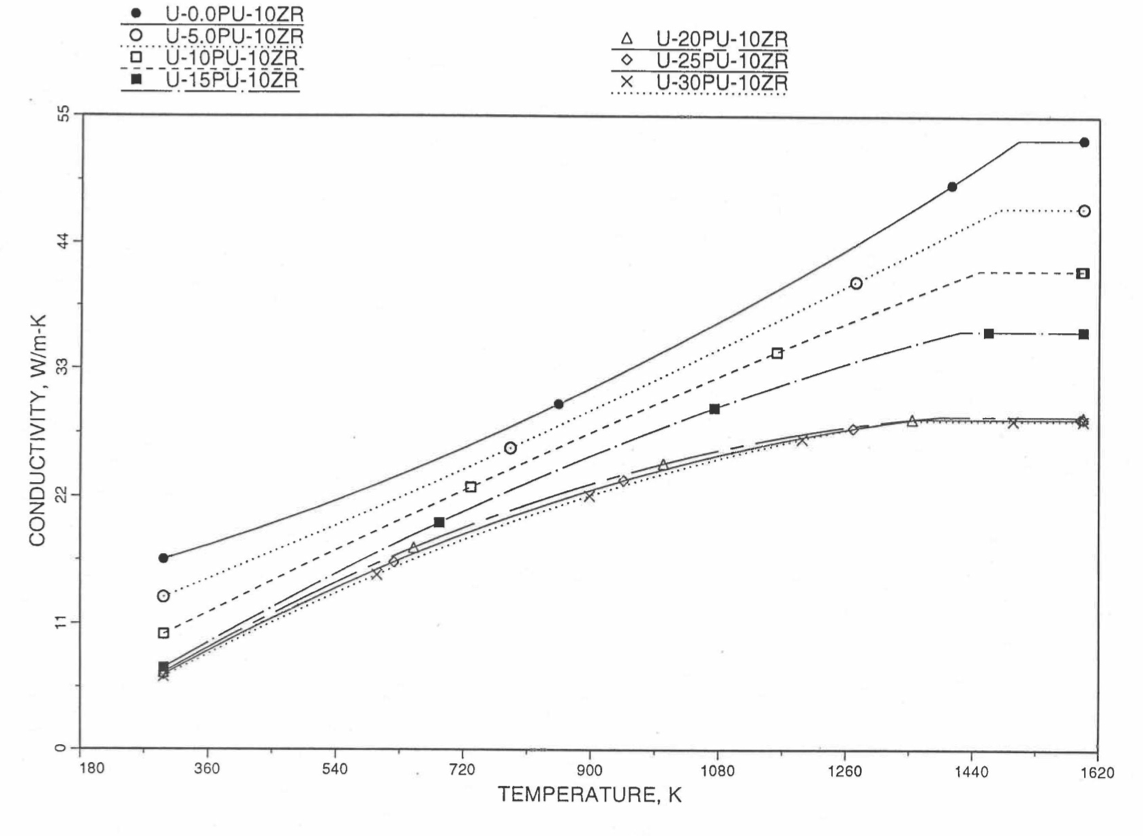
Figure 10.3.69 Thermal Conductivity of 100% Dense U-Pu-10Zr Alloy Fuel, Obtained From Regionwise Interpolation of IFR Handbook Data.
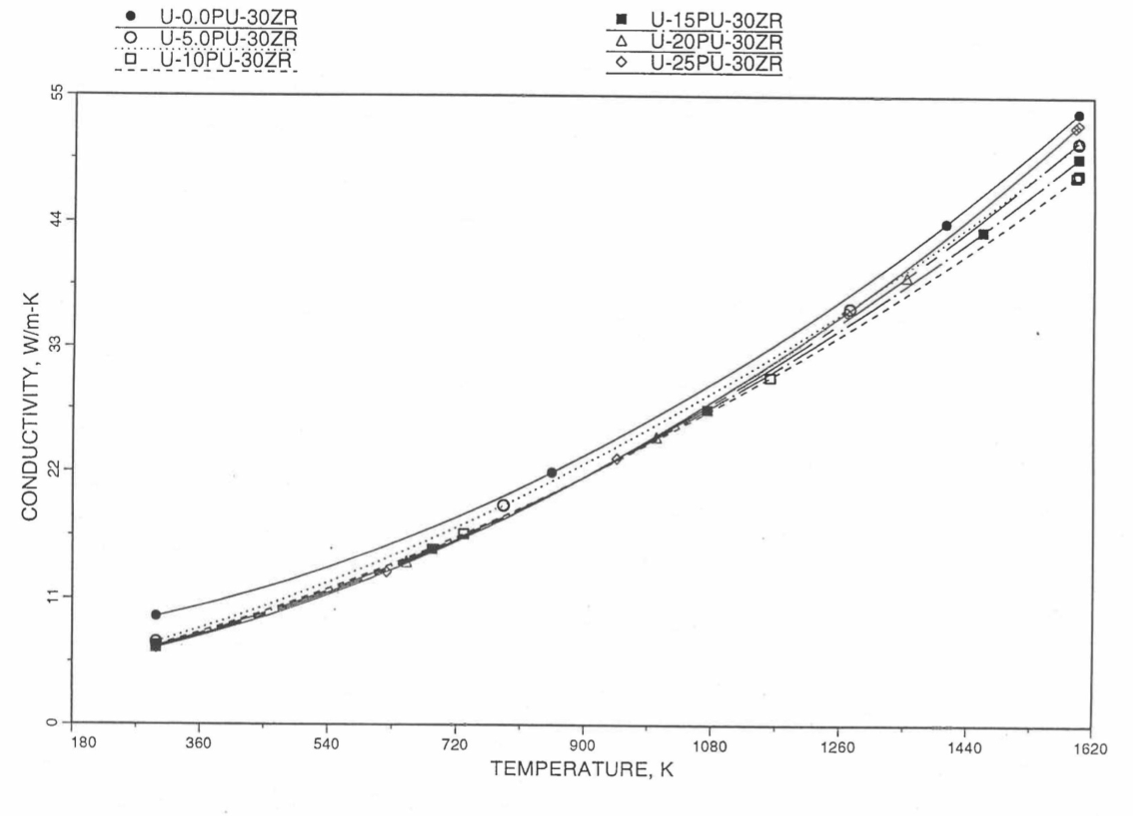
Figure 10.3.70 Thermal Conductivity of 100% Dense U-Pu-30Zr Alloy Fuel, Obtained From Regionwise Interpolation IFR Handbook Data.
10.3.2.6. Burnup or Porosity Correction of Thermal Conductivity
The calculation of thermal conductivity of unirradiated 100% dense U-Pu-Zr alloy fuel as a function of composition and temperature is described in Section 10.3.2.5. The thermal conductivity also depends strongly on the fission gas-filled and logged sodium-filled porosities that form in the fuel during normal steady-state irradiation. This section describes the following two methods that are used in the SAS4A/SASSYS‑1 codes to correct the thermal conductivity of 100% dense U-Pu-Zr alloy fuel for fission gas-filled and logged sodium-filled porosities:
an empirical method based on experimental data for U-Fs alloy fuel thermal conductivity change with burnup in EBR-II,
a theoretical method [10-4, 10-26] that explicitly accounts for the gas-and sodium-filled porosities.
These two options are controlled through the input parameter KFIRR.
10.3.2.6.1. Empirical Correction Based on Average Burnup
No experimental data are available for the effects of irradiation on the thermal conductivity of U-Pu-Zr ternary or U-Zr binary alloy fuel. It is assumed that U-Pu-Zr ternary and U-Zr binary alloy fuels behave during steady-state irradiation in a similar manner to U-5Fs fuel Figure 10.3.68 (for which data re available) with regard to fission gas-induced swelling and sodium logging. The empirical correction factor, i.e., the irradiated-to-unirradiated thermal conductivity ratio, obtained from the analysis of experimental data [10-27 to 10-29] for the effects of irradiation on U-5Fs fuel thermal conductivity, is also used in the Metallic Fuel Handbook [10-8] for the U-Pu-Zr alloy and U-Zr alloy fuels.
A number of irradiation-induced phenomena tend to lower the thermal conductivity of U-5Fs fuel from start-up to about 2 at. % burnup. During this period irradiation, the fuel porosity is not interlinked. Fission gas bubbles and thermal stress-induced microcracking lower the fuel density and thermal conductivity; solid and liquid fission-products buildup tends to lower the thermal conductivity in much the same way as increasing amounts of fissium lower the conductivity; and irradiation damage tends to degrade the thermal conductivity. But the dominant mechanism accounting for the degradation of U-5Fs thermal conductivity from start-up to about 2 at. % burnup is assumed to be the decrease in fuel density due to fission gas-induced swelling and microcracking. Based on the experimental data of diNovi [10-27] and Beck and Fousek [10-28] reviewed in the Metallic Fuels Handbook [10-8], the recommended porosity correction factor, i.e., the irradiated-to-unirradiated thermal conductivity ratio is
(10.3‑69)
where
\(P'\) = porosity fraction relative to the initial 100% dense fuel volume,
\(K\) = thermal conductivity of irradiated fuel,
\(K_{\text{o}}\) = thermal conductivity of unirradiated 100% dense fuel.
The interlinkage of fission gas bubbles is assumed to occur at 2 at. % burnup. Beyond 2 at. % burnup, the effective thermal conductivity tends to increase due to sodium logging and fuel hot pressing, and tends to decrease due to solid and liquid fission-products buildup. But the ingress of bond sodium into the bubbles dominates and improves the thermal conductivity somewhat, as suggested by the in-core measurements of Betten [10-29]. He has reported U-5Fs fuel and coolant thermocouple measurements in an instrumented subassembly, as a function of time to a peak subassembly burnup of 8.8 at. %. From startup to 2 at. % burnup, U-5Fs fuel thermal conductivity shows the expected decrease with burnup due to porosity formation, and the irradiated-to-unirradiated thermal conductivity ratio takes a minimum value of 0.475 with a standard deviation of 0.111. Beyond 2 at. % burnup, the thermocouple measurements show an improvement in the effective thermal conductivity, which levels off, after about 5 at. % burnup, to a steady-state value. The long-time value of U-Fs fuel irradiated-to-unirradiated thermal conductivity ratio is 0.72 with a standard deviation of 0.06.
The minimum value (just before porosity interlinkage at 2 at. % burnup) of irradiated-to-unirradiated thermal conductivity ratio, recommended in the Metallic Fuels Handbook [10-9], for U-Zr binary and U-Pu-Zr ternary fuels is 0.5. The porosity fraction P’, corresponding to this value (i.e., 0.5) of the ratio \(K/K_{\text{o}}\) is obtained from Eq. (10.3-69) to be 0.27. Following a recent recommendation by Billone [10-21] used in Mark-V fuel safety calculations, the porosity fraction is assumed to vary linearly with burnup during early irradiation before porosity interlinkage, equaling 0.27 at 2 at. % burnup.
(10.3‑70)
where
Bu = fuel burnup, at. %.
The long-time value (after porosity interlinkage, sodium logging and fuel hot pressing at burnups beyond 5 at. %) of irradiated-to-unirradiated thermal conductivity ratio, recommended in the IFR Handbook, for U-Zr and U-Pu-Zr fuels is 0.7.
The above conclusions about the empirical correction of U-Pu-Zr alloy fuel thermal conductivity for the effects of steady-state irradiation can be summarized as follows:
(10.3‑71)
10.3.2.6.2. Theoretical Correction Based on Sodium- and Gas-Filled Porosities
The fuel develops fission gas-filled porosities during steady-state operation of the reactor. The bond sodium used in the fuel-cladding gap of U-Pu-Zr alloy fuel pins can also migrate into the fuel and fill some of the porosities of the fuel after porosity interlinkage. The gas-filled porosities tend to decrease the fuel thermal conductivity whereas the sodium-filled porosities tend to increase it. The empirical correction based on average fuel burnup is suitable for transient calculations in which fuel porosity and sodium logging fraction do not change during the transient. If the distributions of fuel porosity and sodium logging fraction change during the transient, a method of correcting fuel thermal conductivity for irradiation effects that explicitly accounts for sodium- and gas-filled porosities is required. In this section a formula is derived for the evaluation of these two effects using a generalization of the method given in Ref. [10-26] for single type of porosity.
Assuming all the gas-filled pores to be cubes of the same size (side \(a_{1}\)) and all the sodium-filled pores to be cubes of another size (side \(a_{2}\)), a unit cell of the porous metallic fuel is constructed that contains a single gas-filled pore and a single sodium-filled pore as shown in Figure 10.3.71. The unit cell is a cube of side L and contains fully dense fuel surrounding the pores. In a real material the pores are not uniformly arranged like atoms in a crystal lattice; so the amount of solid fuel in the unit cell represents an average value. Assuming the heat flow in the y-direction only, the total heat flow through the front x-z face of the unit cell passes through three heat flow paths in parallel: (1) the pore tube containing the gas-filled pore (see Figure 10.3.71), (2) the pore tube containing the sodium-filled pore, and (3) the remaining frontal are of the fully dense fuel of thermal conductivity \(K_{\text{s}}\). The effective thermal conductivity of the unit cell in the y-direction is given by
(10.3‑72)
where
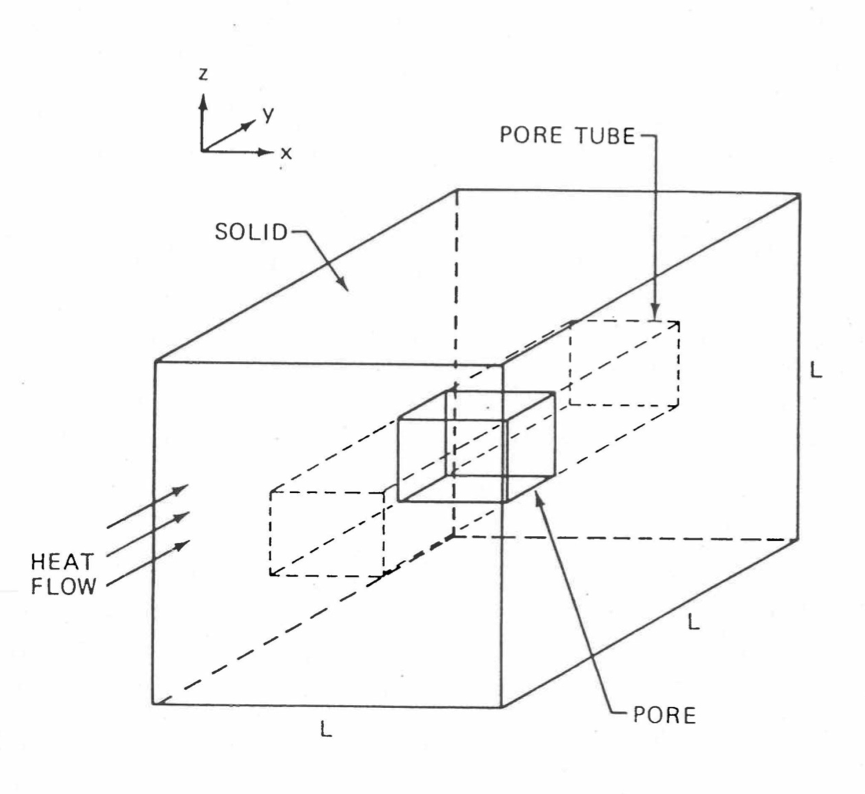
Figure 10.3.71 A Unit Cell of Porous Metallic Fuel Containing a Sodium-Filled Pore and a Gas-Filled Pore (Only One Pore is Shown for Clarity).
\(K\) = effective thermal conductivity of the fuel containing sodium-and gas-filled porosities.
\(P_{\text{c}1}, P_{\text{c}2}\) = fractions of the area of the x-z face of the unit cell that are occupied respectively by the gas-filled pore and the sodium-filled pore,
\(K_{\text{pt}1}, K_{\text{pt}2}\) = apparent thermal conductivities of the pore tubes containing the gas-filled pore and the sodium-filled pore.
The apparent thermal conductivity of a pore tube can be evaluated from the formula for two thermal resistances in series in the y-direction: (1) the pore proper, and (2) the solid fuel contained in the pore tube. For the two pore tubes one obtains the following equations:
(10.3‑73)
(10.3‑74)
where
\(P_{\text{L}1}, P_{\text{L}2}\) = fractions of the side of the unit cell in the y-direction that are occupied respectively by the gas-filled pore and the sodium-filled pore,
\(K_{\text{g}}\) = thermal conductivity of the fission gas contained in the gas-filled pore,
\(K_{\text{Na}}\) = thermal conductivity of the sodium contained in the sodium-filled pore.
Neglecting \(K_{\text{g}}\) in comparison to \(K_{\text{s}}\) and \(K_{\text{Na}}\), and solving Eq. (10.3-73) for \(K_{\text{pt}1}\), it is found that \(K_{\text{pt}1}\) is zero. Substituting this value of \(K_{\text{pt}1}\) and the value of \(K_{\text{pt}2}\) obtained from Eq. (10.3-74) into Eq. (10.3-72), the effective thermal conductivity of the pours fuel can be written
(10.3‑75)
The gas-filled volume porosity, \(P_{\text{g}}\), and the sodium-filled volume porosity, \(P_{\text{Na}}\), can be written as
(10.3‑76)
(10.3‑77)
For the cubic gas-filled pore of side \(a_{1}\) shown in Fig. (Figure 10.3.71),
(10.3‑78)
(10.3‑79)
Equations (10.3-76), (10.3-78) and (10.3-79) give the following relations of \(P_{\text{c}1}\) and \(P_{\text{L}1}\) to the gas-filled volume porosity \(P_{\text{g}}\).
(10.3‑80)
(10.3‑81)
Similarly, \(P_{\text{c}2}\) and \(P_{\text{L}2}\) can be related to the sodium-filled volume porosity, \(P_{\text{Na}}\), as follows:
(10.3‑82)
(10.3‑83)
Substituting Eqs. (10.3-80), (10.3-82) and (10.3-83) into Eq. (10.3-75), the effective thermal conductivity of the porous fuel can be written as
(10.3‑84)
Equation (10.3-84) gives the effect of sodium- and gas-filled porosities on fully dense fuel thermal conductivity. It is noted that Eq. (10.3-84) satisfies two limiting conditions: (1) in the absence of any logged sodium in the fuel, the ratio \(K/K_{\text{s}}\) equals the known reduction factor of \(1 - P_{\text{g}}^{2/3}\) [10-26], and (2) if \(K_{\text{Na}}\) is set equal to \(K_{\text{s}}\) in Eq. (10.3-84), the last two terms on the right-hand side cancel to make \(K/K_{\text{s}}\) again equal to \(1 - P_{\text{g}}^{2/3}\) which is expected when the sodium and the fully dense fuel behave alike and gas-filled porosity is the only nonconductive porosity in the material.
10.3.2.7. Uncertainties of U-Pu-Zr Fuel Thermal Conductivity
The uncertainties of U-Pu-Zr fuel thermal properties are important in the design and safety analyses of the Integral Fast Reactor (IFR). The purpose of the present section is to set the uncertainties of U-Pu-Zr fuel thermal conductivity that are used in the SAS4A/SASSYS‑1 codes.
The uncertainties of U-Pu-Zr fuel thermal conductivity depend on burnup, and therefore the discussion of the subject is divided into two parts: (1) unirradiated U-Pu-Zr fuel, and (2) irradiated U-Pu-Zr fuel. As it will be seen below, the subject of uncertainties of U-Pu-Zr fuel thermal conductivity is a difficult one because of the limited data, and technical judgment has been used in the IFR Metallic Fuels Handbook [10-8, 10-9] to estimate uncertainties in a number of cases.
10.3.2.7.1. Unirradiated U-Pu-Zr Fuel
For evaluating composition- and temperature-dependent U-Pu-Zr fuel thermal conductivity, the IFR Handbook [10-8, 10-9] data have been incorporated into the SAS4A/SASSYS‑1 codes. This evaluation uses a method of regionwise interpolation among quadratic fits to 9 basic unirradiated alloy/component data and Handbook U-Zr binary correlation [10-8]. The quadratic fits of the basic alloy data are done in the temperature variable. Table 10.3.7 lists the accuracy of the data for these 9 basic alloys/components, the maximum errors in the quadratic fits to these data, and the accuracy of the binary correlation. It should be pointed out that two of the required database alloys/components are taken from sources other than the Handbook, and a warning message is printed by the codes then these data are actually used in any calculation. The accuracy of data given in Table 10.3.7 is taken to represent 2 standard deviations (95% confidence limits) because accuracy implies that almost all the data lies within the accuracy band [10-31]. Assuming the accuracy to represent 1 standard deviation would imply that only about two-thirds of the data lies inside the accuracy band and about one-third of the data lie outside, and under this assumption almost all the data would not lie within the accuracy band. The maximum error in quadratic fits given in Table 10.3.7 is also taken to represent 2 standard deviations because all the data actually lies within the maximum error band above and below the fitted quadratic equation in temperature. Assuming the maximum error to represent 3 standard deviations is also justified but this is not done here. Statistically combining the accuracy of data and the error in quadratic fit for each database alloy/component (i.e., square-root of the sum of squares of percent accuracy and percent error), one obtains the combined uncertainty given in the last column of Table 10.3.7. The Pu metal has the largest combined 2-sigma uncertainty of 21.9% but most of this uncertainty arises from the error in the quadratic fit. If the 19.9% maximum error in Pu metal quadratic fit were assumed to represent 3 standard deviations, the combined 1-sigma uncertainty would become \(\left\lbrack \left( 19.9/3 \right)^{2} + \left( 9.2/2 \right)^{2} \right\rbrack^{1/2} = 8.1 \%\). Thus Table 10.3.7 shows that the combined 1-sigman uncertainty can be taken as 10% for unirradiated U-Pu-Zr fuels. This also agrees with the conclusion of Ref. [10-21].
No. |
Alloy/Component |
Source of Data |
Accuracy of Data |
Max. Error in Quadratic Fit |
Combined 2-sigma Uncertainty, % |
|---|---|---|---|---|---|
1 |
U metal |
Handbook |
±20% [a] |
0.72% |
20.0 |
2 |
U-1.5 Zr |
Handbook |
±20% [a] ±5% [Ref 10-18] |
0.41% |
20.0 |
3 |
U-20 Zr |
Handbook |
±20% [a] |
1.71% |
20.1 |
4 |
U-40 Zr |
Handbook |
±20% [a] |
3.13% |
20.2 |
5 |
U-14.7Pu-9.7Ar |
Handbook |
±20% [a] |
1.18% |
20.0 |
6 |
U-18.4Pu-11.5Zr |
Handbook |
±20% [a] |
2.57% |
20.2 |
7 |
U-10Pu |
Ref. [10-21] |
Not reported |
2.34% |
– |
8 |
Pu metal |
Ref. [10-23] |
±9.2% [b] |
19.9% |
21.9 |
9 |
U-16.2Pu-6.2Zr |
Handbook |
±20% [a] |
2.74% |
20.2 |
10 |
Handbook Binary Correlation |
Handbook |
±20% [a] |
[c] |
20.0 |
aAssumed in the Metallic Fuels Handbook [10-8].
bBased on two theoretical calculations of conductivity.
cThe quoted accuracy includes fitting error also.
10.3.2.7.2. Irradiated U-Pu-Zr Fuel
No data is available for the thermal conductivity of irradiated U-Zr binary or U-Pu-Zr ternary fuel [10-8, 10-9]. But data are available for irradiated U-5Fs fuel from 3 experimental sources that are reviewed in the Handbook. It is assumed in the Handbook that U-Zr and U-Pu-Zr fuels behave similar to U-5Fs fuel during irradiation, and the same burnup correction factor may be used for all these fuels. The minimum value (just before porosity interlinkage) for irradiated-to-unirradiated thermal conductivity ratio, \(K/K_{\text{o}}\), recommended in the Handbook for U-Zr binary and U-Pu-Zr ternary fuels is 0.5 ± 0.1. This recommendation is based on rounding off the mean value of this ratio (\(K/K_{\text{o}}\) just before porosity interlinkage) and its standard deviation, 0.475 ± 0.111, reported by Betten [10-29] in one of the 3 experimental sources. This implies a standard deviation of 23.4%. The porosity interlinkage occurs in the 1-2 at. % burnup range [10-8, 10-9, 10-29], and it is assumed to occur at 2 at. % burnup in the SAS4A/SASSYS‑1 codes, following a recent recommendation by Billone [10-21] used in Mark V fuel safety calculations. The standard deviation is assumed to vary linearly with burnup between unirradiated fuel and porosity interlinkage, i.e., zero to 2 at. %.
The long-time value (after porosity interlinkage, sodium logging and fuel hot pressing) for irradiated-to-unirradiated thermal conductivity ratio, \(K/K_{\text{o}}\), recommended in the Handbook [10-9] for U-Zr and U-Pu-Zr fuels is 0.7 ± 0.1. This implies a standard deviation of 14.3%. The plots of \(K/K_{\text{o}}\) versus burnup given in Betten’s experimental work [10-29] show that this long-time value is practically attained at about 5 at. % burnup. This value has also been recommended for Mark V fuel safety calculations [10-21]. The value of \(K/K_{\text{o}}\) and its standard deviation remain constant above this burnup as shown by the plots given in Betten’s experimental work [10-29]. The standard deviation is assumed to vary linearly with burnup between porosity interlinkage and the long-time value attainment, i.e., 2 at. % to 5 at. %.
The conclusions made above about 1-sigma uncertainty can be summarized as follows:
(10.3‑85)
At present the following values of 1-sigma uncertainty have been incorporated in the SAS4A/SASSYS‑1 codes. These values are rounded off and slightly higher than those concluded above. These values are also identical to the uncertainties recommended for Mark V fuel safety calculations [10-21].
(10.3‑86)
10.3.3. Correlations of the Report ANL/RAS 85-19
This section describes the composition and temperature-dependent correlations for thermal properties of U-Pu-Zr alloy fuel which are used by the earlier SSCOMP model [10-4] and other SAS4A/SASSYS‑1 modules. These correlations were developed prior to the issuing of the Metallic Fuels Handbook [10-9] in order to provide an early SAS4A/SASSYS‑1 capability to compute U-Pu-Zr fuel behavior. These correlations for evaluating fuel thermal properties are specified by setting the input parameter IRHOK =1 and the input parameter IFUELM =1 in a channel.
10.3.3.1. Theoretical Density of U-Pu-Zr Fuel at 298K
The theoretical density of U-Pu-Zr fuel at a room temperature of 298K is estimated from the theoretical densities of U, Pu and Zr by assuming that there is no volume change due to alloying of the constituents. This assumption is discussed in more detail below. The theoretical densities of natural (isotopic composition) U at 298K. 239Pu at 294K, and Zr at 293K are found from their crystal structures to be 19.04 g/cm3, 19.816 g/cm3 and 6.52 g/cm3, respectively [10-14]. The minor corrections required in the densities of Pu and Zr due to the small differences between the quoted temperature and the room temperature 298K are made by using the following coefficients of linear expansion given in the same reference.
(10.3‑87)
(10.3‑88)
where
\(\alpha\) = coefficient of linear thermal expansion per °C,
\(T_{\text{c}}\) = temperature on the Centigrade scale.
The theoretical density of 239Pu at 298K after the temperature correction turns out to be 19.805 g/cm3, and that of Zr at 298K is about 6.51 g/cm3 because its temperature correction is negligible for the 5K difference. The theoretical densities of U and Pu can be further corrected for the difference between the actual isotopic average atomic weight and the quoted atomic weight, by multiplying by the ratio of these atomic weights.
(10.3‑89)
(10.3‑90)
where
\(\rho_{\text{th,u}} \rho_{\text{th,p}}\) = theoretical densities of U and Pu at 298K, kg/m3,
\(a_{\text{u}}\) = uranium atomic weight averaged over its actual isotopic composition in fuel,
\(a_{\text{p}}\) = plutonium atomic weight averaged over its actual isotopic composition in the fuel.
The denominators 238.07 and 239.13 of Eqs. (10.3-89) and (10.3-90) are the atomic weights of natural uranium and 239Pu.
The volume of one kilogram of U-Pu-Zr alloy at 298K can be found from Eqs. (10.3-89) and (10.3-90) by summing the volumes of its constituents.
(10.3‑91)
where
\(V_{\text{a}}\) = volume of one kilogram of U-Pu-Zr alloy at 298 K, m3/kg,
\(W_{\text{u}}, W_{\text{p}}, W_{\text{z}}\) = weight fractions of U, Pu and Zr in the alloy.
The theoretical density of U-Pu-Zr alloy at 298K in units of kg/m3 is obtained from Eq. (10.3-91).
(10.3‑92)
where
\(\rho_{\text{th}} \left( T, W_{\text{p}}, W_{\text{z}} \right)\) = theoretical density of U-Pu-Zr alloy at temperature T°K, kg/m3.
Quantity |
Batch R250 |
Batch R253Z |
|---|---|---|
U, Pu and Zr weight ratios |
73.4/13.8/12.2 |
75.9/14.8/9.4 |
U, Pu and Zr weight fractions |
0.738/0.139/0.123 |
0.758/0.148/0.094 |
Isotopic composition of U, 235U/238U wt % |
93.19/6.81 |
93.19/6.81 |
Isotopic composition of U, 239Pu/240Pu/242Pu wt % |
91.35/7.85/0.77/0.035 |
91.35/7.85/0.77/0.035 |
Average atomic weight of U |
235.32 |
235.32 |
Average atomic weight of Pu |
239.22 |
239.22 |
Estimated (using Eq. 10.3-92) theoretical density of U-Pu-Zr fuel, kg/m3 |
15360 |
16080 |
Measured density averaged over all the fuel slugs in the batch, kg/m3 |
15280 |
15750 |
Table 10.3.8 shows a comparison of measured densities of two batches of injection cast U-Pu-Zr fuel slugs [10-3] with the theoretical densities estimated from Eq. (10.3-92). The comparison is satisfactory for these two fuel compositions although further comparison for alloys of other compositions, specifically the alloy compositions in the annular zones formed at the end of steady-state irradiation of U-Pu-Zr fuel pins, is required to test the validity of the assumption of no volume change during alloying. The small difference may be due to measurement error, small voids left during the injection casting process or some volume change taking place during alloying.
10.3.3.2. Thermal Expansion of U-Pu-Zr Fuel
The U-Pu-Zr alloys show strong discontinuities in the coefficient of linear thermal expansion when the alloys are heated through the phase transformation temperatures [10-15]. There is some variation between the coefficients of linear expansion of alloys of different compositions but there is not enough data available to correlate this variation as a function of composition. This fuel properties option assumes the coefficient of linear expansion to be independent of composition, and uses the thermal expansion of U-15 wt % Pu-10 wt % Zr for all alloy compositions. The measured values of U-15 wt % Pu-10 wt % Zr alloy linear thermal expansion have been correlated as follows:
(10.3‑93)
where
\(\frac{\Delta L \left( T \right)}{L_{1}}\) = linear thermal expansion from a fixed temperature 298K to any temperature T, expressed as a fraction of length \(L_{1}\) at the temperature 298K.
Using Eqs. (10.3-92) and (10.3-93), the following equation for the theoretical density of U-Pu-Zr alloy fuel at any temperature T in units of kg/m3 is obtained:
(10.3‑94)
10.3.3.3. Enthalpy and Specific Heat of U-Pu-Zr Fuel
The composition-dependent enthalpy and specific heat of U-Pu-Zr alloy at any temperature up to is solidus temperature are estimated by mass-weighted averaging of the enthalpy and specific heat data of U, Pu and Zr metals, assuming that the heat of formation of the alloy is negligible. The heat of formation of the alloy is assumed negligible due to lack of data.
Each of the constituent metals of the U-Pu-Zr alloy undergoes certain crystallographic phase transformations in the solid state which require considerable heat addition and enthalpy increase at the transformation temperatures. The specific heat data of U, Pu, and Zr excluding these heats of solid-state transformations [10-10] are given in Tables 10.3-9 to 10.3-11, and plotted in Figure 10.3.72 to Figure 10.3.74. In each plot, the value of specific heat between the highest solid-state transformation temperature and the melting point is shown extrapolated to a temperature of 2000K for curve-fitting purposes, although the fitted equations are used only up to a solidus temperature of the U-Pu-Zr alloy. Because the heat transfer routines of the SAS4A/SASSYS‑1 codes were initially written for the mixed-oxide fuel without any heat of solid-heat transformation, the heats of solid-state transformations of U, Pu and Zr are required to be included in their specific heats by spreading the corresponding enthalpy jumps over a temperature range. This spreading is not all artificial because these solid-state transformations actually occur over a temperature range in the U-Pu-Zr alloy. Hence the equations fitted to the specific heat and enthalpy data of U, Pu and Zr metals are required (1) to be continuous (no sudden jumps at any temperature) for the purpose of accuracy and convergence of the numerical solution in the SAS4A/SASSYS‑1 heat transfer routines, (2) to include the heats of solid-state transformations such that the fitted equations cross the enthalpy jumps close to their midpoints, and (3) to closely reproduce the enthalpy and specific heat data away from the solid-state transformations. When one polynomial could not be fitted over the whole temperature range, the data for each metal was fitted in two parts: a polynomial over the lower temperature range covering most of the solid-state transformations, and an equation of the form a+b/Tn over the higher temperature range. The following equations for the specific heats (in units of J/kg-K) of U, Pu and Zr metals and the U-Pu-Zr alloy are obtained.
(10.3‑95)
(10.3‑96)
(10.3‑97)
(10.3‑98)
where
\(C_{\text{pu}} \left( T \right), C_{\text{pp}} \left( T \right), C_{\text{pz}} \left( T \right)\) = specific heats of U,Pu and Zr metals at temperature T, J/kg-K,
\(C_{\text{p}} \left( T, W_{\text{p}}, W_{\text{z}} \right)\) = composition-dependent specific heat of the U-Pu-Zr alloy, J/kg-K,
\(W_{\text{u}}, W_{\text{p}}, W_{\text{z}}\) = weight fractions of U,Pu and Zr in the U-Pu-Zr alloy.
Equations (10.3-95) to (10.3-97) for the specific heats of U, Pu and Zr metals are compared with the data of Tables 10.3-9 to 10.3-11 in Figure 10.3.72 to Figure 10.3.74. The lower and the higher temperature-range-fitted equations join without any discontinuity at the range interface temperature. The enthalpies obtained by integrating Eqs. (10.3-95) to (10.3-97) are compared with the measured data of Tables 10.3-9 to 10.3-11 in Figure 10.3.75 to Figure 10.3.77. The enthalpy obtained from the higher temperature-range-fitted equation merges asymptotically with the data. A comparison of the enthalpy obtained from Eq. (10.3-98) for alloys of several compositions (e.g., those formed in the annular zones) is required to test the validity of this technique.
10.3.3.4. Thermal Conductivity of U-Pu-Zr Fuel
The thermal conductivity of U-Pu-Zr alloy (up to its solidus temperature) as a function of temperature and composition has been obtained by evaluating the effect of alloying plutonium on the thermal conductivity of U-Zr binary alloy. The thermal conductivity of U-Zr binary alloy is known for the full range of composition [7-14] and is shown in Figure 10.3.78. Alloying usually reduces the thermal conductivity substantially. The reduction in the U-Zr binary thermal conductivity due to alloying Pu with it is evaluated using the thermal conductivity data available for three U-Pu-Zr ternary alloys prepared in casting numbers D-44, D-54 and D-50 [10-19, 10-20] and given in Table 10.3.12.
Figure 10.3.78 shows that the thermal conductivity of U-Zr binary alloy decreased linearly with Zr atom fraction in the range of zero to 0.5. Therefore, quadratic functions are least-square fitted to the pure uranium thermal conductivity data and to the U-50 atom % zr binary alloy data of Figure 10.3.78, and then the thermal conductivity of any U-Zr binary alloy in the composition range of zero to 50 at. % Zr is linearly interpolated between these two quadratics. The resulting equations are as follows:
(10.3‑99)
(10.3‑100)
(10.3‑101)
Temperature, K |
Specific Heat |
Enthalpy Above |
|
|---|---|---|---|
cal/mol-K |
J/kg-K |
298.15K, cal/mol |
|
298.15 |
6.61 |
116.2 |
0.0 |
400.0 |
7.10 |
124.8 |
698 |
500.0 |
7.65 |
134.5 |
1434 |
600.0 |
8.31 |
146.1 |
2231 |
700.0 |
9.08 |
159.7 |
3099 |
800.0 |
9.99 |
175.7 |
4050 |
900.0 |
11.02 |
193.8 |
5103 |
941.0 (α) |
11.47 |
201.7 |
5563 |
941.0 (β) |
10.26 |
180.4 |
6230 |
1000.0 |
10.26 |
180.4 |
6836 |
1048.0 (β) |
10.26 |
180.4 |
7327 |
1048.0 (γ) |
9.15 |
160.9 |
8464 |
1100.0 |
9.15 |
160.9 |
8939 |
1200.0 |
9.15 |
160.9 |
9854 |
1300.0 |
9.15 |
160.9 |
10769 |
1400.0 |
9.15 |
160.9 |
11684 |
1500.0 |
9.15a |
160.9a |
12599a |
2000.0 |
9.15a |
160.9a |
17174a |
a The constant value of the γ-U-phase specific heat has been extrapolated to temperatures up to 2000K for curve-fitting purposes.
Temperature, K |
Specific Heat |
Enthalpy Above |
|
|---|---|---|---|
cal/mol-K |
J/kg-K |
298.15K, cal/mol |
|
298.15 |
7.64 |
133.7 |
0.0 |
395.0 (α) |
8.20 |
143.5 |
772 |
395.0 (β) |
8.00 |
140.0 |
1612 |
400.0 |
8.03 |
140.6 |
2277 |
480.0 (β) |
8.60 |
150.5 |
2417 |
480.0 (γ) |
8.30 |
145.3 |
2585 |
500.0 |
8.53 |
149.3 |
3378 |
588.0 (γ) |
9.50 |
166.3 |
3508 |
600.0 (δ) |
9.00 |
157.5 |
3616 |
700.0 |
9.00 |
157.5 |
4516 |
730.0 (δ) |
9.00 |
157.5 |
4786 |
730.0 (δ’) |
9.00 |
157.5 |
4806 |
753.0 (δ’) |
9.00 |
157.5 |
5013 |
753.0 (ε) |
8.40 |
147.0 |
5453 |
800.0 |
8.40 |
147.0 |
5848 |
900.0 |
8.40 |
147.0a |
6688 |
1000.0 |
8.40a |
147.0a |
7528a |
2000.0 |
8.40a |
147.0a |
15928a |
a The constant value of the ε-U-phase specific heat has been extrapolated to temperatures up to 2000K for curve-fitting purposes.
Temperature, K |
Specific Heat |
Enthalpy Above |
|
|---|---|---|---|
cal/mol-K |
J/kg-K |
298.15K, cal/mol |
|
298.15 |
6.06 |
278.1 |
0.0 |
400.0 |
6.54 |
300.1 |
646 |
500.0 |
6.78 |
311.1 |
1313 |
600.0 |
7.01 |
321.7 |
2003 |
700.0 |
7.23 |
331.8 |
2714 |
800.0 |
7.45 |
341.9 |
3449 |
900.0 |
7.68 |
352.4 |
4205 |
1000.0 |
7.90 |
362.5 |
4984 |
1100.0 |
8.13 |
373.1 |
5785 |
1136.0 (α) |
8.20 |
376.3 |
6079 |
1136.0 (β) |
7.50 |
344.2 |
7020 |
1200.0 |
7.50 |
344.2 |
7500 |
1400.0 |
7.50 |
344.2 |
9000 |
1600.0 |
7.50 |
344.2 |
10500 |
1800.00 |
7.50 |
344.2 |
12000 |
2000.0 |
7.50 |
344.2 |
13500 |

Figure 10.3.72 Uranium Specific Heat Correlation Including the Heats of SolidState Transformations.

Figure 10.3.73 Plutonium Specific Heat Correlation Including the Heats of SolidState Temperature.

Figure 10.3.74 Zirconium Specific Heat Correlation Including the Heats of SolidState Transformations.
where
\(T_{\text{c}}\) = temperature of the alloy, °C,
\(A_{\text{u}}, A_{\text{p}}, A_{\text{z}}\) = atom fractions of U, Pu and Zr in the U-Pu-Zr ternary alloy. For a U-Zr binary alloy, \(A_{\text{p}}\) is zero.
\(K_{\text{u}}\) = thermal conductivity of pure uranium, W/cm-°C,
\(K_{\text{u}50}\) = thermal conductivity of U-50 atom % Zr binary alloy, W/cm°C,
\(K_{\text{uz}}\) = thermal conductivity of any U-Zr binary alloy in the composition range of zero to 50 atom % Zr, W/cm-°C.
Equations (10.3-99) and (10.3-100) reproduce the thermal conductivity data shown in Figure 10.3.78 for pure uranium and U-50 atom % Zr binary alloy with a maximum error of 1.5%. Equation (10.3-101) for the thermal conductivity of U-Zr binary alloys has been compared in Table 10.3.13 with the data [10-18] for U-20 wt. % Zr (U-39.5 atom & Zr) binary alloy and the maximum error is about 5%. Equation (10.3-101) is so written that it determines the thermal conductivity of the U-Zr binary alloy to which Pu can be added to obtain the desired U-Pu-Zr ternary alloy with U, Pu and Zr atom fractions equal to \(A_{\text{u}}, A_{\text{p}}\) and \(A_{\text{z}}\). The addition of Pu to the U-Zr binary alloy decreases the thermal conductivity. Because of a lack of the ternary alloy thermal conductivity data at widely spaced Pu atom fractions, only a linear dependence on Pu atom fraction is assumed in this evaluation.
(10.3‑102)
where
\(K_{\text{o}} \left( T_{\text{c}}, A_{\text{p}}, A_{\text{z}} \right)\) = thermal conductivity at temperature \(T_{\text{c}}\) °C of the solid (i.e., nonporous) U-Pu-Zr ternary alloy having U, Pu and Zr atom fractions equal to \(A_{\text{u}}, A_{\text{p}}\) and \(A_{\text{z}}\), W/cm-°C.
In Eq. (10.3-102), the coefficient \(C\) is independent of \(A_{\text{p}}\) and models the effect of alloying Pu with the U-Zr binary.
Temperature, °C |
Thermal Conductivity, W/cm-°C |
||
|---|---|---|---|
Casting D-44a |
Casting D-54a |
Casting D-50a |
|
100 |
0.109 |
0.100 |
0.092 |
200 |
0.142 |
0.132 |
0.117 |
300 |
0.177 |
0.164 |
0.144 |
400 |
0.210 |
0.196 |
0.171 |
500 |
0.241 |
0.225 |
0.197 |
600 |
0.264 |
0.253 |
0.219 |
700 |
0.280 |
0.278 |
0.234 |
800 |
0.293 |
0.301 |
0.248 |
900 |
0.301 |
0.323 |
0.260 |
1100b |
0.322 |
0.368 |
0.286 |
1300b |
0.343 |
0.413 |
0.312 |
1500b |
0.364 |
0.458 |
0.338 |
1700b |
0.385 |
0.503 |
0.364 |
1900b |
0.406 |
0.548 |
0.390 |
2000b |
0.417 |
0.571 |
0.403 |
a The composition of castings:
D-44 is U-16.2 wt & Pu-6.2 wt % Zr (U-14.7 at. % Pu-14.7 at.% Zr
D-54 is U-14.7 wt & Pu-9.7 wt % Zr (U-12.7 at. % Pu-21.9 at.% Zr
D-50 is U-18.4 wt & Pu-11.5 wt % Zr (U-15.5 at. % Pu-25.3 at.% Zr
b The data in Ref. [10-19, 10-20] have been extrapolated linearly to temperatures up to 2000°C for curve fitting purposes.

Figure 10.3.75 Uranium Enthalpy Obtained by Integrating its Specific Heat Correlation.

Figure 10.3.76 Plutonium Enthalpy Obtained by Integrating its Specific Heat Correlation.

Figure 10.3.77 Zirconium Enthalpy Obtained by Integrating its Specific Heat Correlation.

Figure 10.3.78 Thermal Conductivity of the Uranium-Zirconium Binary Alloy for the Full Range of Composition.
Temperature, °C |
Thermal Conductivity, W/cm-°C |
||
|---|---|---|---|
Data |
Equation |
% Error |
|
20 |
0.11 |
0.109 |
-0.8 |
100 |
0.13 |
0.124 |
-4.6 |
200 |
0.15 |
0.145 |
-3.5 |
300 |
0.17 |
0.168 |
-1.3 |
400 |
0.20 |
0.193 |
-3.4 |
500 |
0.22 |
0.221 |
0.5 |
600 |
0.25 |
0.251 |
0.6 |
700 |
0.28 |
0.284 |
1.5 |
800 |
0.31 |
0.319 |
2.9 |
900 |
0.34 |
0.357 |
4.9 |
Thermal Conductivity, W/cm-°C |
|||
|---|---|---|---|
Temperature, °C |
U-Pu-Zr Casting |
U-Zr Binary With U to Zr Atom Ratio Same as Casting |
Coefficient C |
Casting Number D-44, U-14.7 at.% Pu-14.7 at.% Zr Alloy |
|||
100 |
0.109 |
0.190 |
0.554 |
200 |
0.142 |
0.212 |
0.477 |
300 |
0.177 |
0.236 |
0.404 |
400 |
0.210 |
0.263 |
0.362 |
500 |
0.241 |
0.292 |
0.351 |
600 |
0.264 |
0.324 |
0.412 |
700 |
0.280 |
0.359 |
0.537 |
800 |
0.293 |
0.396 |
0.701 |
900 |
0.301 |
0.435 |
0.916 |
Casting Number D-54, U-12.7 at.% Pu-21.9 at.% Zr Alloy |
|||
100 |
0.100 |
0.167 |
0.529 |
200 |
0.132 |
0.188 |
0.445 |
300 |
0.164 |
0.212 |
0.381 |
400 |
0.196 |
0.238 |
0.336 |
500 |
0.225 |
0.267 |
0.335 |
600 |
0.253 |
0.299 |
0.361 |
700 |
0.278 |
0.332 |
0.431 |
800 |
0.301 |
0.369 |
0.536 |
900 |
0.323 |
0.408 |
0.668 |
Casting Number D-50, U-15.5 at.% Pu-25.3 at.% Zr Alloy |
|||
100 |
0.092 |
0.152 |
0.390 |
200 |
0.117 |
0.173 |
0.365 |
300 |
0.144 |
0.197 |
0.344 |
400 |
0.171 |
0.223 |
0.337 |
500 |
0.197 |
0.252 |
0.354 |
600 |
0.219 |
0.283 |
0.412 |
700 |
0.234 |
0.316 |
0.531 |
800 |
0.248 |
0.352 |
0.673 |
900 |
0.260 |
0.390 |
0.843 |
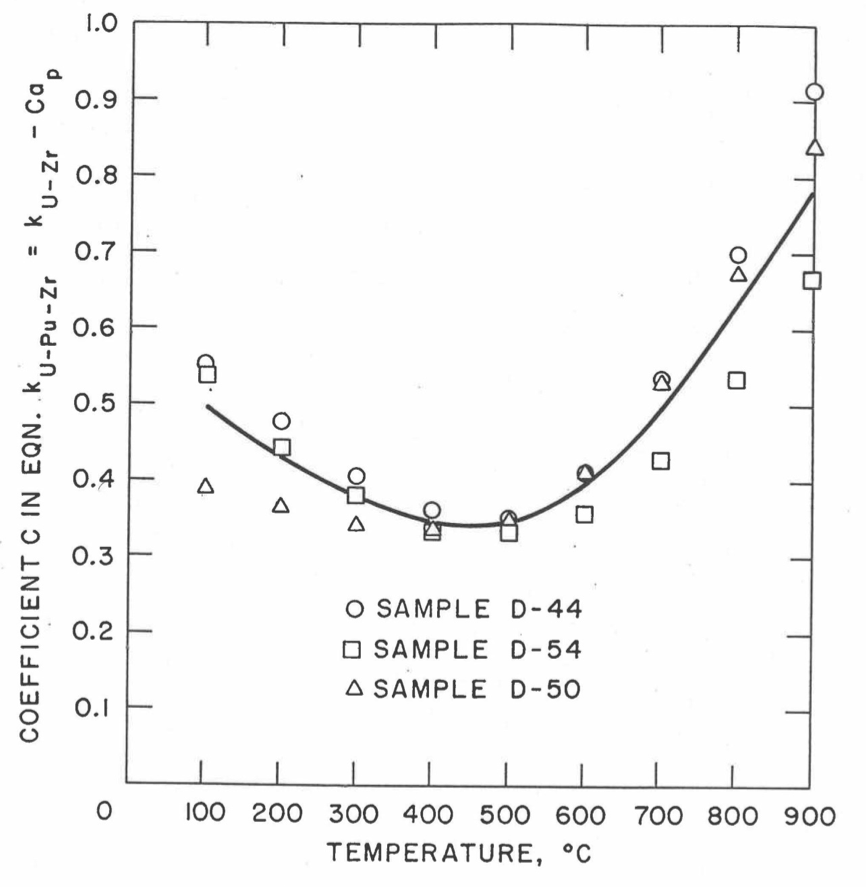
Figure 10.3.79 Plot of Coefficient C vs. Temperature Obtained from Thermal Conductivity Data for U-Pu-Zr Samples D-44, D-54 and D-50.
The coefficient \(C\) has been evaluated (see table 10.3-14) from the thermal conductivity data given in Table 10.3.12 for three U-Pu-Zr alloys prepared in casting numbers D-44, D-54 and D-50 [10-19, 10-20], and Figure 10.3.79 shows a plot of these values of the coefficient \(C\) versus temperature. The scatter in Figure 10.3.79 indicates that the coefficient \(C\) may have a weak dependence on Zr atom fraction in addition to the main dependence on temperature. The following two equations have been developed for evaluating the coefficient \(C\): (1) a second degree polynomial of temperature only (ignoring the weak dependence on Zr atom fraction) least-squared fitted to the data given in Table 10.3.12 up to 900°C using \(A_{\text{p}}^{2}\) as the weighting factor, and (2) a second degree polynomial of temperature with its coefficients linearly depending on Zr atom fraction least-square fitted to all the data given in Table 10.3.12 up to 2000°C using \(\left\lbrack K_{\text{o}} \left( T_{\text{c}}, A_{\text{p}}, A_{\text{z}} \right) \right\rbrack^{-2}\) as the weighting factor. The \(A_{\text{p}}^{2}\) weighting factor was used to reduce the errors in the first fitting equation at higher Pu atom fractions and make them nearly equal to the errors at lower Pu atom fractions. The \(1/K_{\text{p}}^{2}\) weighting factor was used in the second case for the purpose of minimizing the mean fractional error in thermal conductivity. The fitted equations are given below with their expected ranges of validity.
(10.3‑103)
(10.3‑104)
Figure 10.3.80 to Figure 10.3.82 compare the U-Pu-Zr alloy thermal conductivity obtained from Eqs. (10.3-102) and (10.3-104) with the data for the three U-Pu-Zr alloys prepared in casting numbers D-44, D-54 and D-50 [10-19, 19-20]. The correlation compares well with all the base data with a root mean square error of 5% and a maximum error of about 10%. Equation (10.3-104) for evaluating the coefficient \(C\) covers a wider range of composition and temperature than Eq. (10.3-103) and is preferred. Further comparison for alloys of other compositions (i.e., those formed in the annular zones) and at temperatures higher than 900°C is required to test the validity of the assumptions used in this correlation.
The IFR Handbook correlation given by Eq. (A10.2-1) reproduces all the base data of Table 10.3.12 over the temperature range 100-900°C with a maximum error of about 20% compared to the maximum error of about 10% in the correlation Eqs. (10.3-102) and (10.3-104).
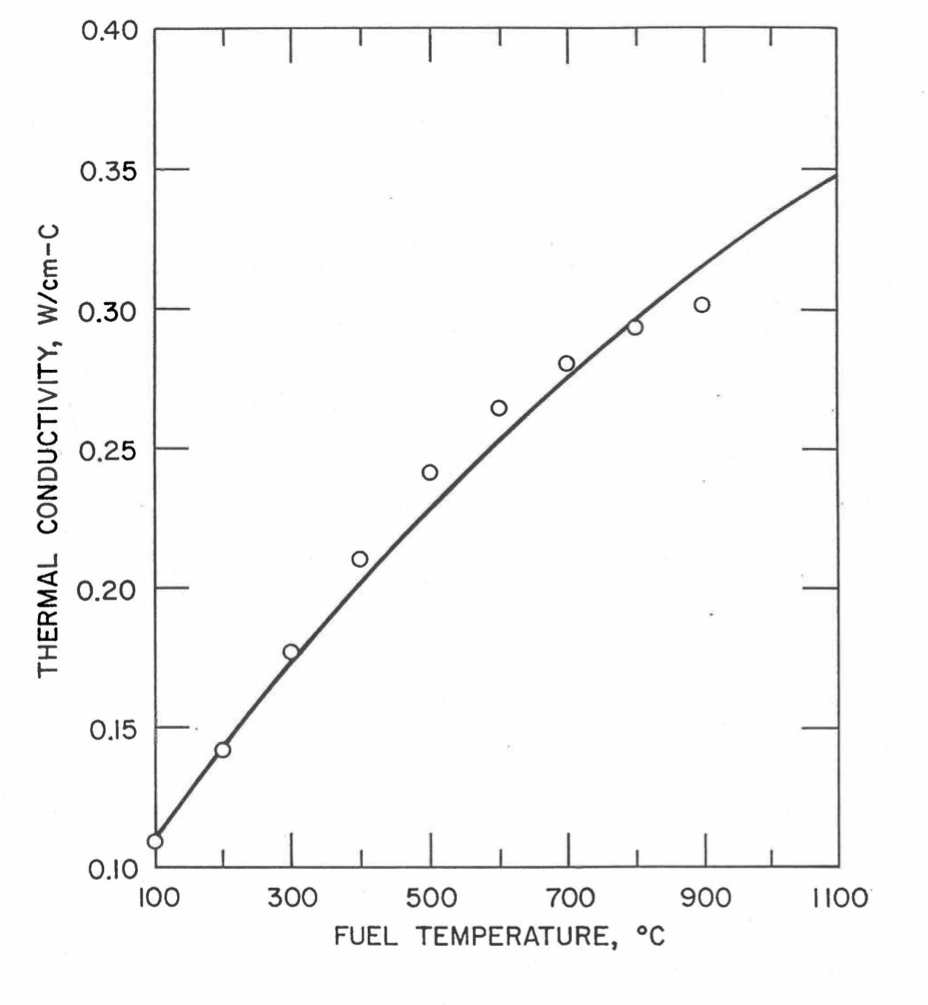
Figure 10.3.80 Comparison of the Thermal Conductivity Correlation Eqs. (10.3-102) and (10.3-104) with the Data for the U-Pu-Zr Sample D-44.
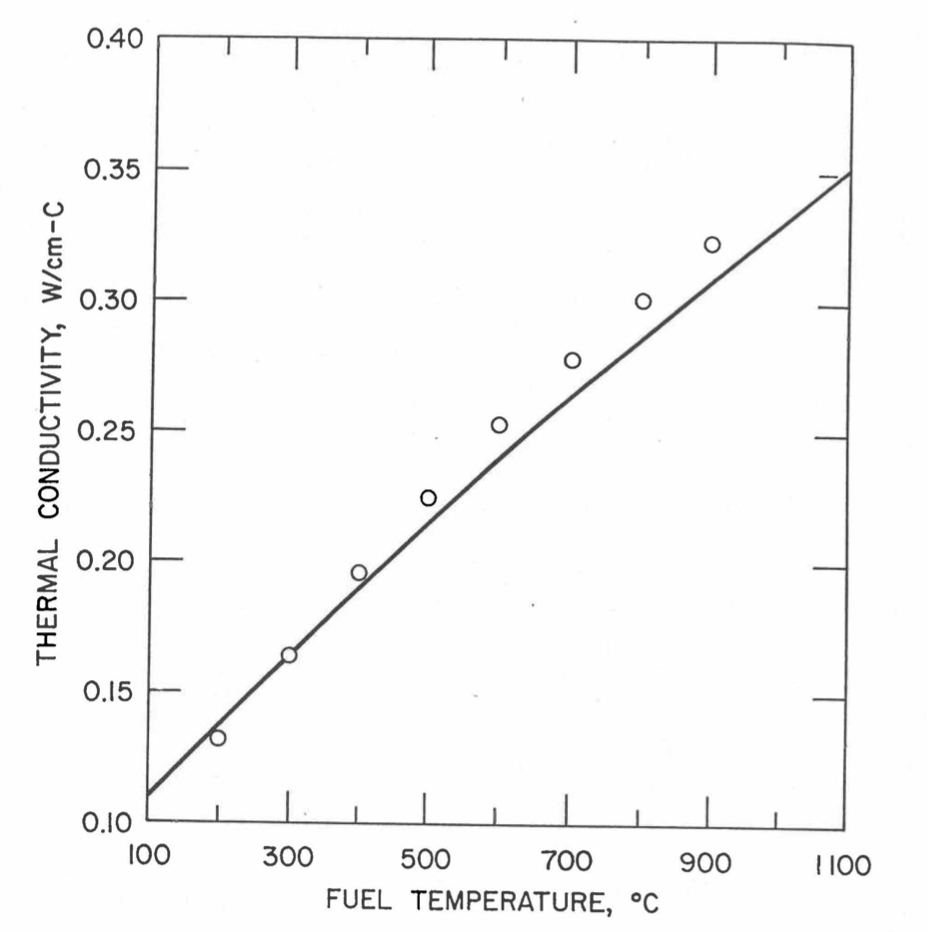
Figure 10.3.81 Comparison of the Thermal Conductivity Correlation Eqs. (10.3-102) and (10.3-104) with the Data for the U-Pu-Zr Sample D-54.

Figure 10.3.82 Comparison of the Thermal Conductivity Correlation Eqs. (10.3-102) and (10.3-104) with the Data for the U-Pu-Zr Sample D-50.
10.3.3.5. Porosity Correction of Fuel Thermal Conductivity
The correlation for the thermal conductivity of unirradiated 100%-dense U-Pu-Zr alloy fuel is described in Section 10.3.3.4 for the fuel properties option specified by setting the input parameter IRHOK=1 and the input parameter IFUELM=1 in a channel. The thermal conductivity also depends strongly on the fission gas-filled and logged sodium-filled porosities that form in the fuel during normal steady-state irradiation. Two methods to correct the thermal conductivity of 100%-dense U-Pu-Zr alloy fuel for fission gas-filled and logged sodium-filled porosities have been described in Section 10.3.2.6: (i) an empirical method based on experimental data for U-5Fs alloy fuel, and (ii) a theoretical method that explicitly accounts for the gas- and sodium-filled porosities. Only the theoretical method is available for irradiation-effects correction in this fuel properties option as shown by the flow diagrams of subroutines FK and KFUEL in Figure 10.3.3 and Figure 10.3.5.
10.3.4. Properties of Some Specific Fuels
Before the implementation in SAS4A/SASSYS‑1 codes of composition- and temperature- dependent fuel thermal properties by the method of regionwise interpolation [10-31] of the Metallic Fuels Handbook [10-8] data, thermal properties of two specific fuels, i.e., Mark-V (U-20Pu-10Zr) ternary and U-10Zr binary alloy fuels, were incorporated into the codes by Briggs [10-32] to perform EBR-II Mark-V fuel safety calculations. These thermal properties are in the form of temperature-dependent correlations that were developed by Billone [10-12, 10-21, 10-22] based on data reported in the Metallic Fuels Handbook [10-8]. For the purpose of reproducing these safety calculations if required in future, these thermal property correlations have been retained in the codes and are used by setting the input parameter IRHOK-1 and the input parameter IFUELM-2 in a channel. In this fuel properties option, the specific heat and theoretical density of Mark-V ternary and U-10Zr binary fuels (specified by setting the input parameter IMETAL = 2 or 3 respectively) are evaluated using the following correlations:
Mark-V (U-20Pu-10Zr) Fuel (IMETAL=2)
(10.3‑105)
(10.3‑106)
(10.3‑107)
U-10Zr binary Fuel (IMETAL=3)
(10.3‑108)
(10.3‑109)
where
\(C_{\text{p}}\) = specific heat, J/kg-K
\(T\) = fuel temperature, K
\(\rho_{\text{th}}\) = theoretical density, kg/m3
\(\frac{\Delta L \left( T \right)}{L_{\text{o}}}\) = linear thermal expansion from 293K to temperature T, expressed as a fraction of length \(L_{\text{o}}\) at the temperature 293K.
\(W_{\text{z}} = 0.1\), the zirconium weight fraction in the fuel.
It is important to note that the specific heats of Mark-V and U-10Zr fuels over the melting range, obtained from Eqs. (10.3-105) and (10.3-108), are the actual values, and are not consistent with the method of Section 3.3.5 for adjusting fuel temperature (computed without accounting for heat of fusion during the main heat transfer calculation) to account for heat of fusion of any radial mesh interval that is going through the melting range. To be consistent with the method (see subroutine TSHTN5), the fuel specific heat used here must be the value for solid fuel just below solidus or the value for molten fuel just above liquidus.
The unirradiated 100%-dense fuel thermal conductivity, for both Mark-V and U-10Zr fuels, is evaluated using Eq. (A10.2-2) from the atom fractions of Pu and Zr in the fuel. These atom fractions are evaluated in the SAS4A/SASSYS‑1 codes, using the following relations in this fuel properties option.
(10.3‑110)
(10.3‑111)
where
\(A_{\text{p}}, A_{\text{z}}\) = atom fractions of Pu and Zr in the fuel,
\(W_{\text{p}}, W_{\text{z}}\) = weight fractions of Pu and Zr in the fuel.
As discussed in Section 10.7.2, this thermal conductivity correlation should not be used for any other alloy composition besides Mark-V and U-10Zr fuels because it is ill-behaved, and so recommended by Billone [10-22]. For these two fuels, this correlation has been found to be correct. The correction of the 100% dense fuel thermal conductivity for the effects of steady-state irradiation is done using the empirical method described in Section 10.3.2.6. For the purpose of reproducing EBR-II Mark-V fuel safety calculations if required in future (which is the main purpose of providing this fuel properties option), the theoretical method of correcting for irradiation effects is not available in this option. Finally, to account for the uncertainties in the U-Pu-Zr thermal conductivity data forming the basis of this correlation (i.e., Eq. A10.2-2), the thermal conductivity obtained after correcting for irradiation effects is divided by an input uncertainty factor FUNKFU.
10.3.5. Computer Implementation
The U-Pu-Zr alloy composition in each computational cell of the fuel is at present specified both axially and radially by input data determined from the examination fuel pins with similar irradiation histories. Input data are handled by annular fuel zones (central, middle and outer composition zones) but the codes internally have arrays by radial node to store U-Pu-Zr fuel composition and composition-dependent quantities. The choice of input data by fuel zone is based on the fact that analysts communicate commonly in terms of zones, and that this simplifies input data preparation. The use of storage by radial node is based on the fact that this reduces logical IF statements from coding, especially in molten material motion models. This should simplify the codes and improve the running time. The addition of composition-dependent fuel thermal properties in the input data is an option in the codes, and the user should be able to run no-zone formation cases without preparing the input data for multiple fuel zones. This section describes the functions of all the fuel thermal property subroutines, the related input data, and internal arrays.
10.3.5.1. List of Fuel Thermal Property Subroutines
The following is a list of all the fuel thermal property subroutines with a brief description of their functions:
Name |
Descriptions |
|---|---|
CFUEL |
Computes specific heat of mixed-oxide, U-Fs and U-Pu-Zr alloy fuels for a range of fuel radial nodes in an axial segment, with specified temperatures and U-Pu-Zr compositions. |
CFUEL1 |
Computes U-Pu-Zr alloy fuel specific heat as a function of composition and temperature by regionswise interpolation of Metallic Fuels Handbook enthalpy data. |
FK |
Computes thermal conductivity of mixed-oxide, U-Fs and U-Pu-Zr alloy fuels for a single fuel radial node in an axial segment, with specified temperature, porosity and U-Pu-Zr composition. In the case of metal fuels, it also accounts for the effect of sodium logging. |
HFUEL1 |
Computes U-Pu-Zr alloy fuel enthalpy as a function of composition and temperature by regionwise interpolation of Metallic Fuels Handbook enthalpy data. |
KFUEL |
Computes thermal conductivity of mixed oxide, U-Fs and U-Pu-Zr alloy fuels for a range of fuel radial nodes in an axial segment, with specified temperatures, porosity and U-Pu-Zr compositions. In the case of metal fuels, it also accounts for the effect of sodium logging. |
KFUEL1 |
Computes thermal conductivity of unirradiated 100%-dense U-Pu-Zr alloy fuel as a function of composition and temperature, by the method of regionwise interpolation of Metallic Fuels Handbook thermal conductivity data. |
PELTON |
Computes solidus and liquidus temperatures of U-Pu-Zr alloy fuel as a function of composition, by the method of chemical thermodynamic equilibrium between conjugate solid and liquid solutions. |
PRECAL |
Ppre-calculates, before steady-stat calculation, a number of parameters stored for fast evaluation of U-Pu-Zr specific heat, theoretical density and thermal conductivity by fuel type. |
RHOF |
Computes theoretical density of mixed-oxide, U-Fs and U-Pu-Zr alloy fuels for a specified temperature and U-Pu-Zr composition. |
RHOFM |
Computes theoretical density of U-Pu-Zr fuel as function of composition and temperature, and also returns the fractional linear thermal expansion over the input temperature range. |
THEXP1 |
Computes fractional linear thermal expansion of U-Pu-Zr alloy fuel as a function of composition and temperature, by the method of regionwise interpolation of Metallic Fuels Handbook data. |
TRTEMP |
Evaluates the first and last solid-state transition temperatures of U-Pu-Zr alloy fuel as a function of composition. |