12.12. Sample Output
Samples of the voiding model output are presented in Figure 12.12.1 and Figure 12.12.2. A brief discussion of the data contained in these figures will be given shortly, but first, an explanation of the categories of information listed will be presented. Beginning with the first line of headings in the output, the items listed are as follows:
- bubble number
the row to which this heading belongs gives information about each bubble that is currently in the channel. The bubble number identifies each bubble uniquely and is assigned in the order in which the bubbles are formed.
- gas type
in future modeling, bubbles will be allowed to contain fission gas or fission gas/sodium vapor mixtures, as well as pure sodium vapor, and the composition of the bubble will be identified by the gas type number. For now, all bubbles are gas type 1 (pure sodium vapor).
- interface position
this gives the axial position, in meters, of the lower and upper vapor-liquid interfaces of each bubble in the channel. Bubbles are listed in this section of the output in increasing order of axial position.
- velocity
the velocity with which each interface is moving is given in this column in meters per second.
- pressure
the saturation vapor pressure at each interface in pascals.
- vapor and liquid temperatures
as discussed in the introduction to the chapter, sharp temperature gradients are sometimes present at liquid-vapor interfaces, so at each interface, the code computes a vapor temperature and a liquid temperature a short distance away from the interface. These two temperatures are listed in the output for each interface in kelvins.
- boiling time
This is the time in seconds that has elapsed since the bubble was formed.
- cladding film thickness
this is the thickness in meters of the liquid sodium film which is present on the cladding in the vapor region by the liquid-vapor interface.
- cladding film velocity
in a later version of the code, the liquid film on the cladding will be allowed to move, and this column will show the speed in meters per second with which the film is moving at the interfaces. At the moment, the film velocity is considered to be zero.
- structure film thickness
the thickness in meters of the liquid film on the structure in each interfacial vapor region.
- axial node
this heading begins a new section of the printout in which information is presented on a node-by-node basis. The axial node number identifies each axial mesh segment interface.
- axial position
this is the height along the channel, in meters, of each axial node.
- coolant pressure
this is the saturation pressure, in pascals, at each axial node. If the node is contained in a liquid slug, it is the pressure in the liquid, and if the node is part of a vapor bubble, it is the vapor pressure.
- coolant flow rate
this is the mass flow rate, in kilograms per second, of the sodium at each node. In liquid nodes, it is the flow rate of the liquid sodium, while in vapor nodes it is that of the sodium vapor.
- cladding film velocity
this is the velocity in meters per second of the liquid sodium film on the cladding at each axial node. As mentioned above in the discussion of film velocity at the interfaces, the film velocity is currently set to zero in the code.
- cladding film thickness
the thickness in meters of the liquid film on the cladding. This variable is a constraint over a given axial mesh segment (just as the coolant flow area is), and therefore it should actually be designated by axial segment number rather than by axial node number. Since the segment number is just the node number of the node at the bottom of the segment, this variable is listed in the output by the axial node number for segments 1 through MZC-1, with the entry for axial node MZC to be ignored.
- clad temperature
this is the cladding temperature, in kelvins, at the midpoint of each axial mesh segment. The comments just made about the listing of the clad film thickness in the output therefore also apply to the cladding temperature; that is, the axial node numbers should be regarded as axial segment numbers for this variable.
- saturation temperature
the saturation temperature in kelvins corresponding to the coolant pressure. This variable is calculated at the axial anodes and is listed in that format in the output.
- structure temperature
the temperature in kelvins of the structure material. Like the cladding temperature, it is calculated at the mesh segment midpoints and is listed as such in the output.
- structure film thickness
the thickness in meters of the liquid sodium film on the structure. It is constant over a given axial mesh segment and is thus listed by segment number.
- TCBAR2
this is the coolant temperature in kelvins at the midpoint of the mesh segment. The heading is jus the name of the variable used in the coding. It is listed by mesh segment, just as the cladding and structure temperatures are.
- reflector temperature
the temperature in kelvins in the reflector regions. It too, is computed at the midpoint of the mesh segment and is given by segment number.
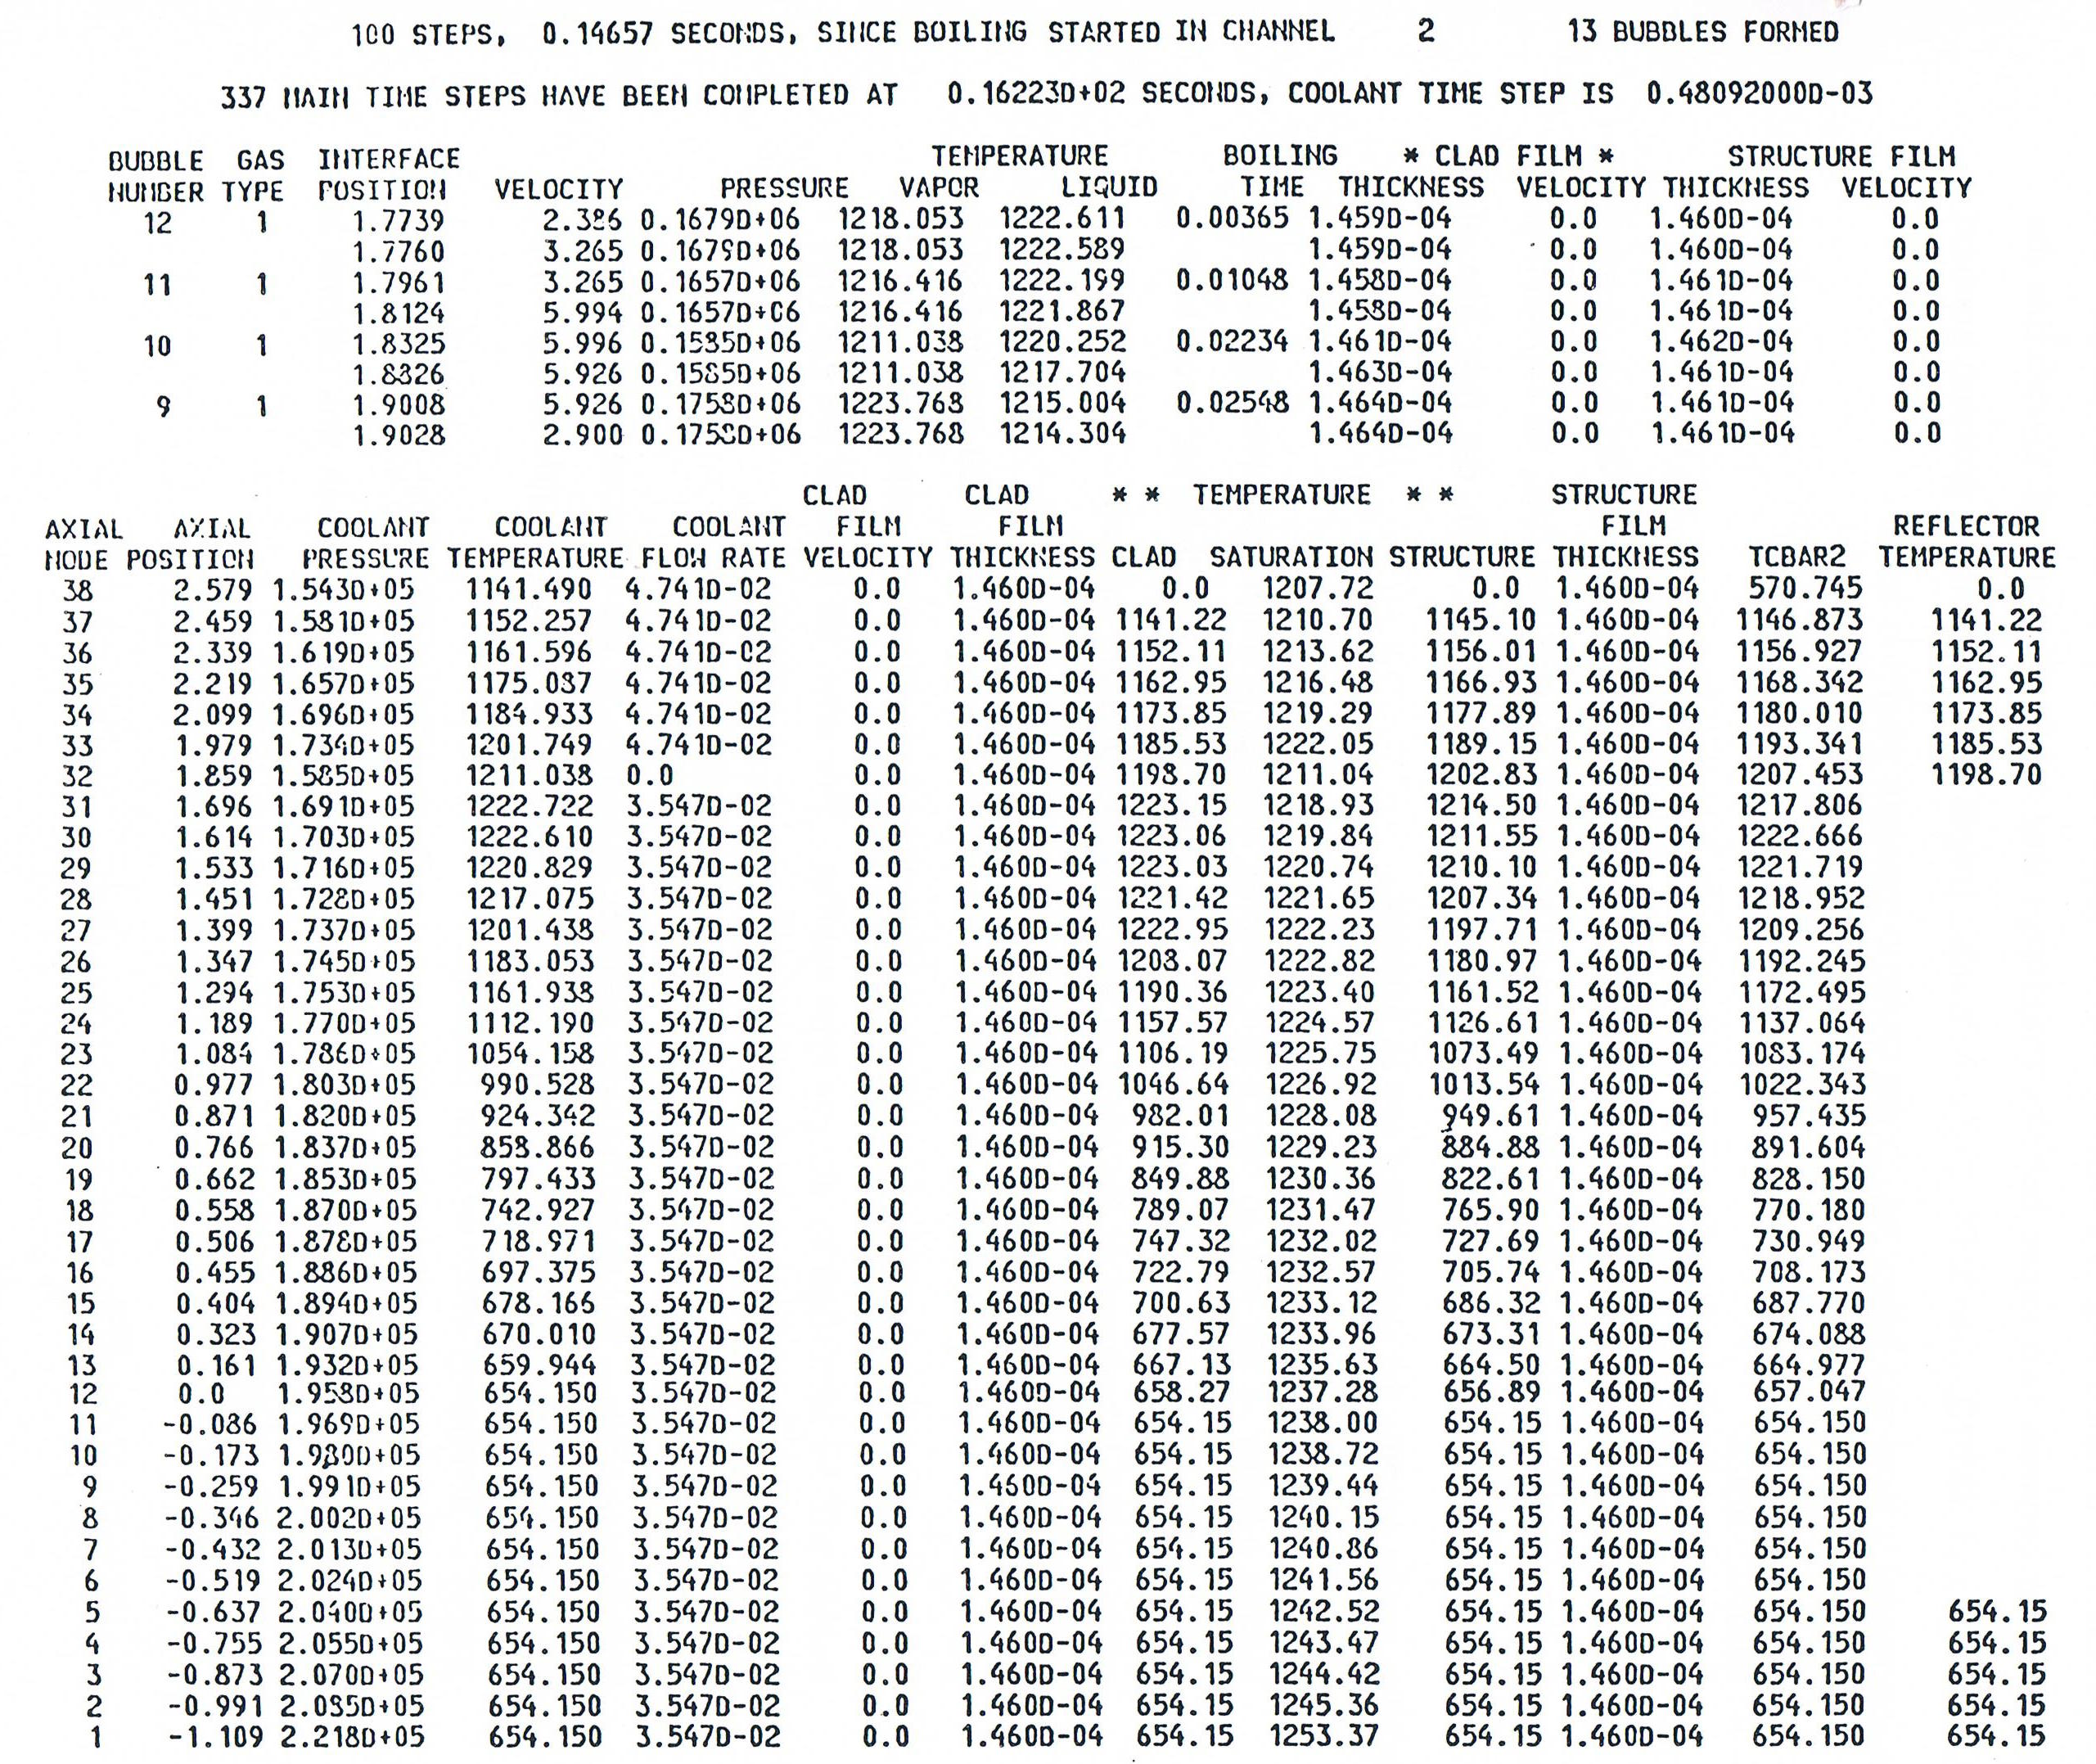
Figure 12.12.1 and Figure 12.12.1 show two examples of data presented in the format just discussed. Both are taken from a run made for the analysis of a loss-of-flow case. Figure 12.12-1 gives information about conditions in the lead channel a short time after voiding initiation. Already, twelve bubbles have formed and the first seven have either collapsed or been swept out of the channel. At this point, all the bubbles are small enough to use the uniform vapor pressure model, as shown by the axially constant pressure and vapor temperature in each bubble. Most of the bubbles are contained in one axial mesh segment, but one, bubble 10, spans a segment interface; this produces the mass flow rate of zero in node 32, since the flow rate is assumed to be zero in the uniform-vapor-pressure model.
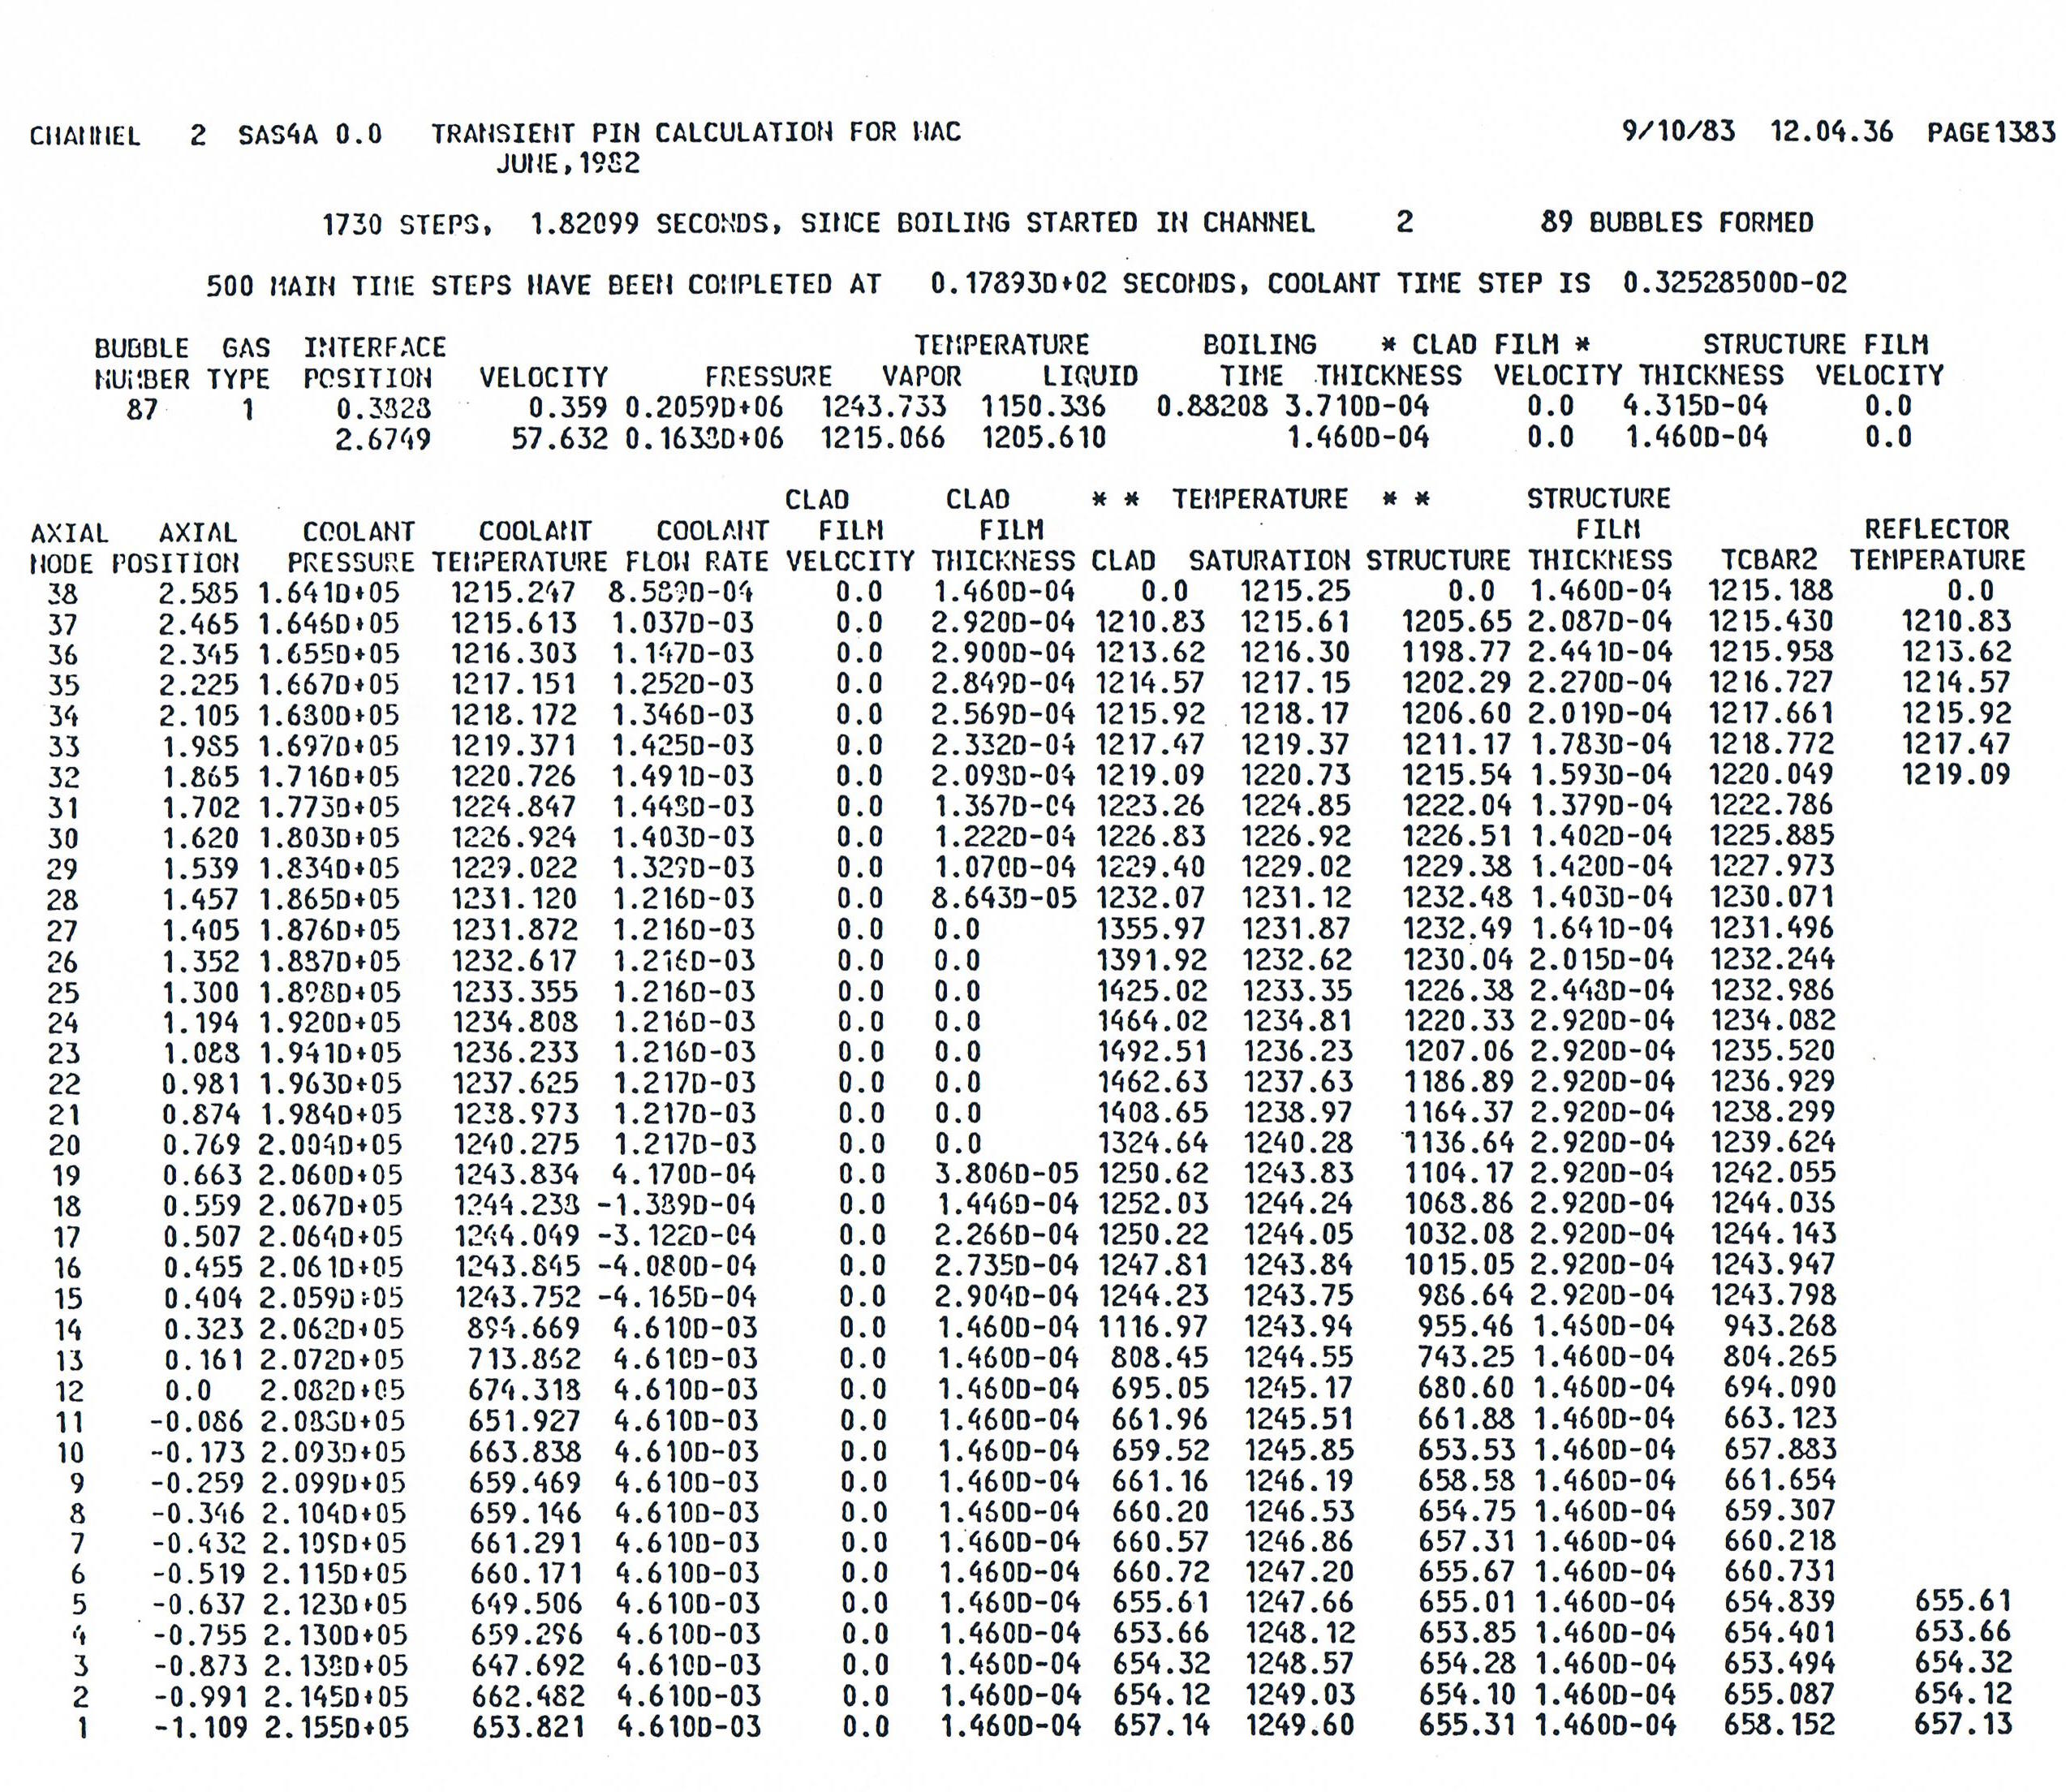
Figure 12.12.2 presents data about the same channel at a more advanced stage of voiding. Only one bubble is present in the channel, although more than ninety have been formed since voiding started. The pressure-gradient model is now in operation, and the upper bubble interface is past the top of the channel. A significant region of the cladding has experienced film dryout (i.e., the film thickness calculated by the code has dropped below a user-input minimum value and therefore the thickness has been set to zero), resulting in the high cladding temperatures shown in that region. On the other hand, the structure is cold enough that liquid has condensed on it, increasing the thickness of the film. This has also happened in some areas of the cladding. Note the large temperature difference at the lower void interface between the vapor and liquid temperatures, more than 100 K.

Figure 12.12.1 Example of a Printout from the Voiding Model Shortly after Voiding Initiation

Figure 12.12.2 Example of a Printout from the Voiding Model at an Advanced Stage of Boiling